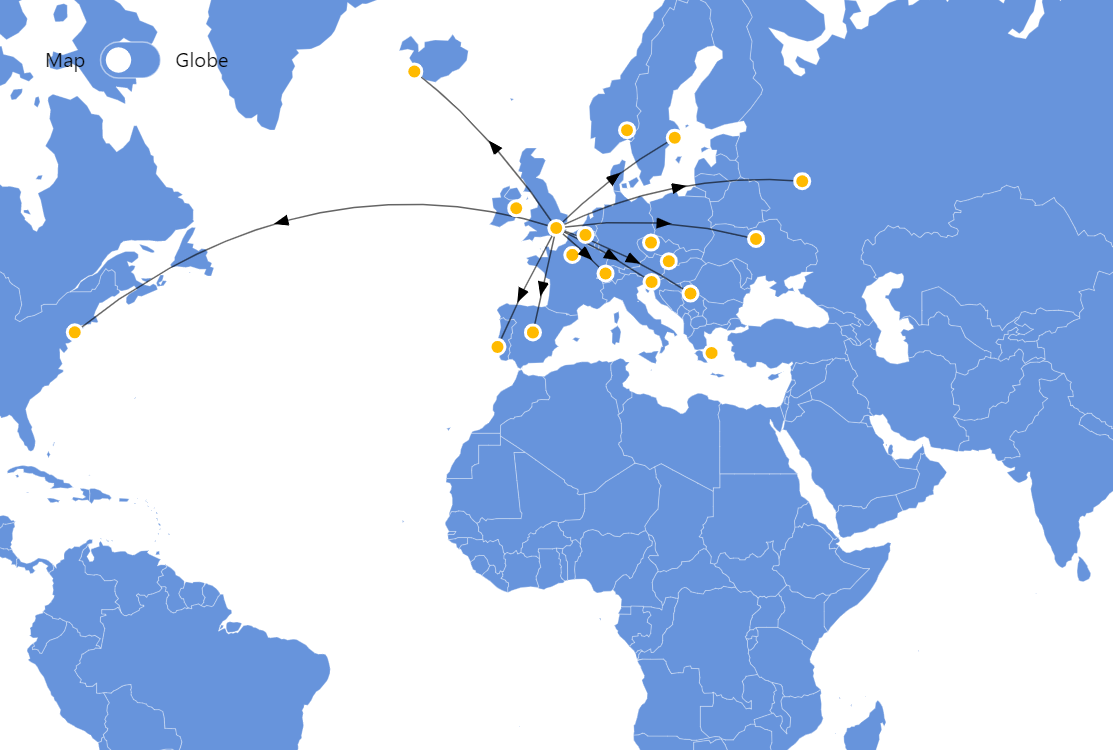
Map with Curved Lines
As you probably know, flat maps are not exactly geometrically accurate and we use different projections to transform our globe onto a flat surface. For this reason a straight (shortest path) line going from point A to point B wouldn’t be straight on a projected map. amCharts Maps takes care of this and enables you to create lines curved according to the current projection without doing any work to get there.
Key implementation details
To get the curved trajectory lines we just add a MapLineSeries to our chart, add data items to it with points to connect and amCharts Maps takes care of the rest.
Another interesting point in this demo is those map grid lines. You also get them for free by adding a GraticuleSeries to your map chart.
Related tutorials
Build this chart with AI
The prompt below can be used to build this chart with AI. For best coding results, use the most advanced AI models, like Claude Opus 4.6 and GPT-5.3-Codex. For more info and tips, check out amCharts AI docs.
Create an interactive map visualization showing curved trajectory lines connecting 17 cities across Europe and internationally, with London as the origin. Place golden circular markers at each city location with name tooltips. Draw faint connection lines connecting London to each destination. Add directional arrows at the midpoint of each line that auto-rotate to match the line direction. Lines should curve naturally based on the map projection. Include a toggle button to switch between a flat map and a 3D globe view. Auto-zoom to London at 3x magnification on load. Show a subtle graticule grid. Animate on load. Cities should have a name, title, and coordinates. Use amCharts 5 library.
Demo source