Radar Chart
Radar chart (also known as web chart, spider chart, star chart, etc.) is used to display data as circular two-dimensional plots. In the scope of amCharts you can think of radar charts as circular XY charts with a lot of the same concepts applicable throughout.
Key implementation details
We start by creating an instance of RadarChart. The key point when adding axes to a radar chart is using special axis renderers. For the circular X axis (countries in this example) we use AxisRendererCircular and for the value axis (Y) we use AxisRendererRadial. Then we use RadarLineSeries for the actual plot.
Related tutorials
Build this chart with AI
The prompt below can be used to build this chart with AI. For best coding results, use the most advanced AI models, like Claude Opus 4.6 and GPT-5.3-Codex. For more info and tips, check out amCharts AI docs.
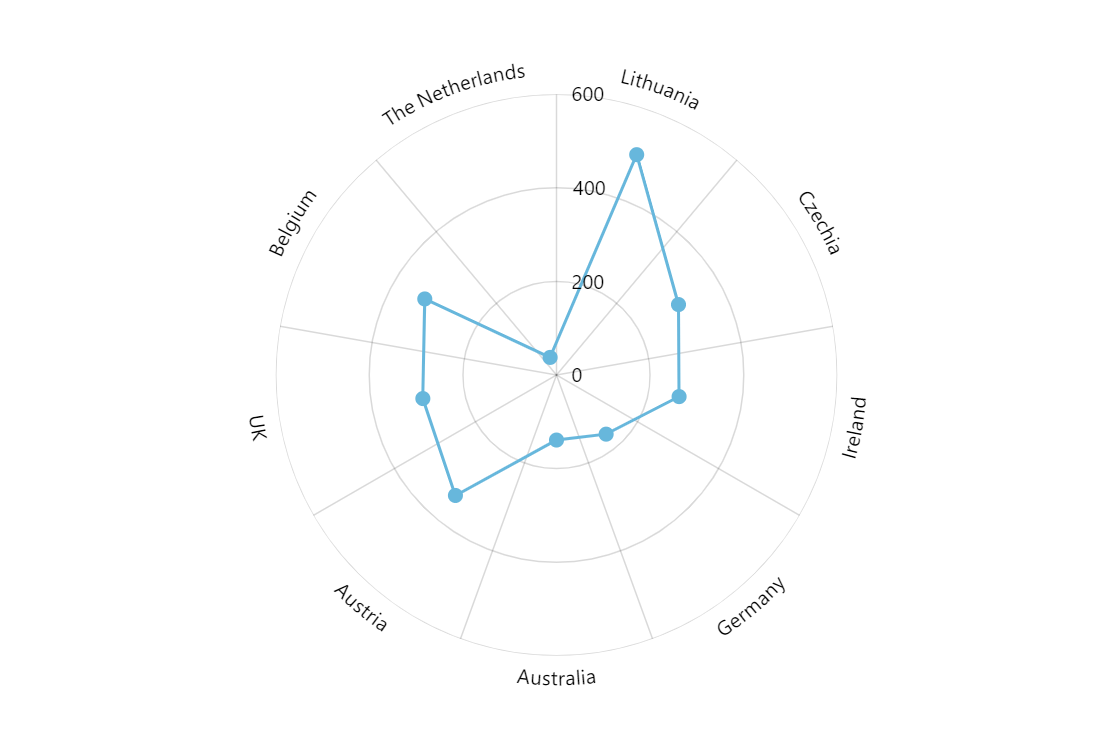
Create a radar chart (spider/web chart) with a circular axis displaying 9 country names (Lithuania, Czechia, Ireland, Germany, Australia, Austria, UK, Belgium, Netherlands) and a radial value axis. Plot a single line series connecting data points with a thin stroke, and add small circular bullet markers at each intersection. Display values in litres (e.g., Lithuania: 501, Czechia: 301, etc.). Configure the cursor with the vertical guide line hidden. Disable axis panning; enable mouse wheel for panning and zooming. Show tooltips with exact values on hover. Animate series and chart on load. Use amCharts 5 library.
Demo source