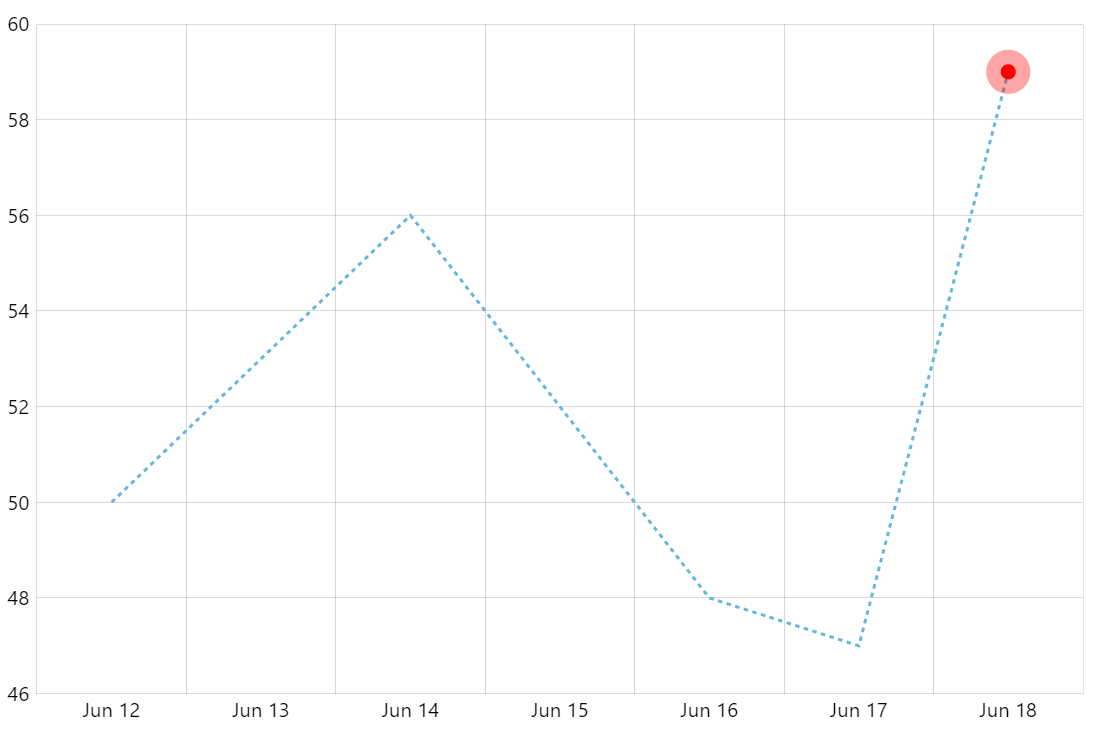
Animated Bullet at the End of the Series
Displaying a pulsating element at a data point on a chart is a great way to attract viewer’s attention. This demo shows you how to do it with amCharts.
Key implementation details
To achieve this effect we create a bullet comprising of two circles. Then we animate both radius and opacity on one of them using built-in animation tools. And that’s it.
Related tutorials
Build this chart with AI
The prompt below can be used to build this chart with AI. For best coding results, use the most advanced AI models, like Claude Opus 4.6 and GPT-5.3-Codex. For more info and tips, check out amCharts AI docs.
Create a line chart with 7 daily data points using a dashed stroke style. At the final data point only, display a pulsating animated bullet made of two concentric red circles where the outer circle continuously expands and fades. Include an XY cursor with horizontal line only, tooltips, and pan on both axes. Animate on load. Use amCharts 5 library.
Demo source