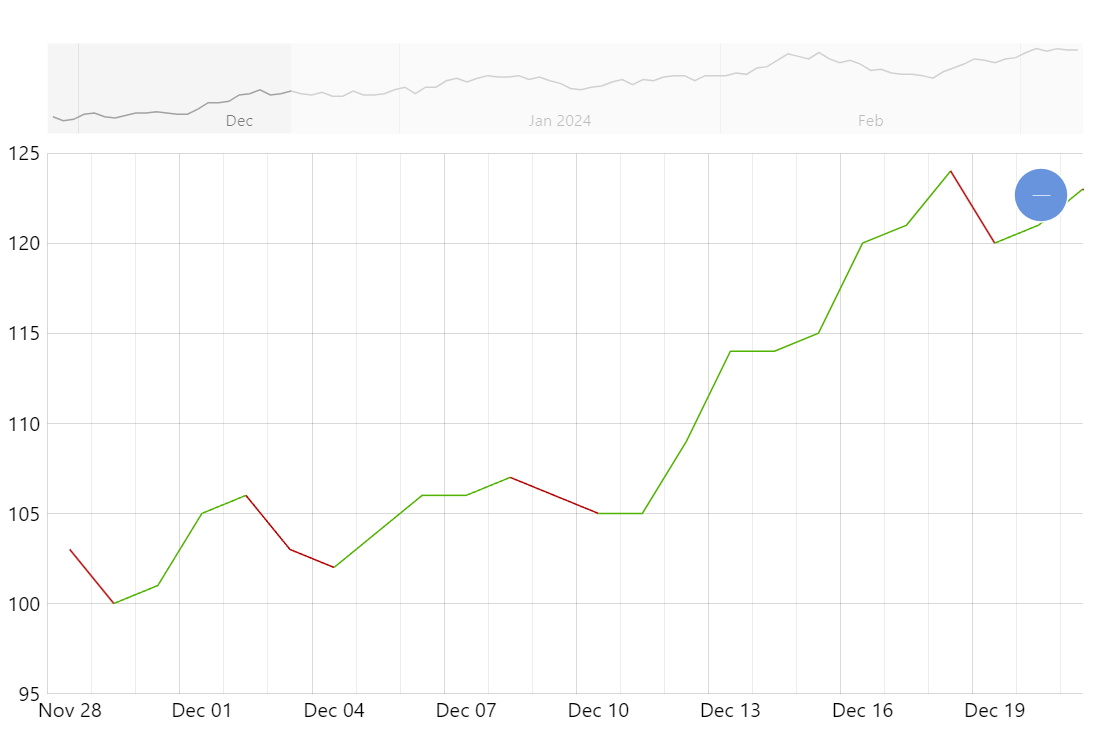
Line with Different Colors for Ups and Downs
Sometimes it’s great to emphasize the trend in data by coloring the line according to the direction of value changes.
Key implementation details
The key here is “massaging” the data to add a color field according to the trend. Then we can use that data field in the strokes.template for the series.
Additionally, we adjust the tooltip background color each time tooltip position changes using the color from the data item it’s pointing to.
Related tutorials
Build this chart with AI
The prompt below can be used to build this chart with AI. For best coding results, use the most advanced AI models, like Claude Opus 4.6 and GPT-5.3-Codex. For more info and tips, check out amCharts AI docs.
Create a line chart with 100 daily data points where line segments dynamically change color: green for upward movement and red for downward movement, based on comparison with the previous value. Match tooltip background colors to segment direction. Add an XY cursor, pan/zoom on both axes, and a horizontal scrollbar. Animate on load. Use amCharts 5 library.
Demo source