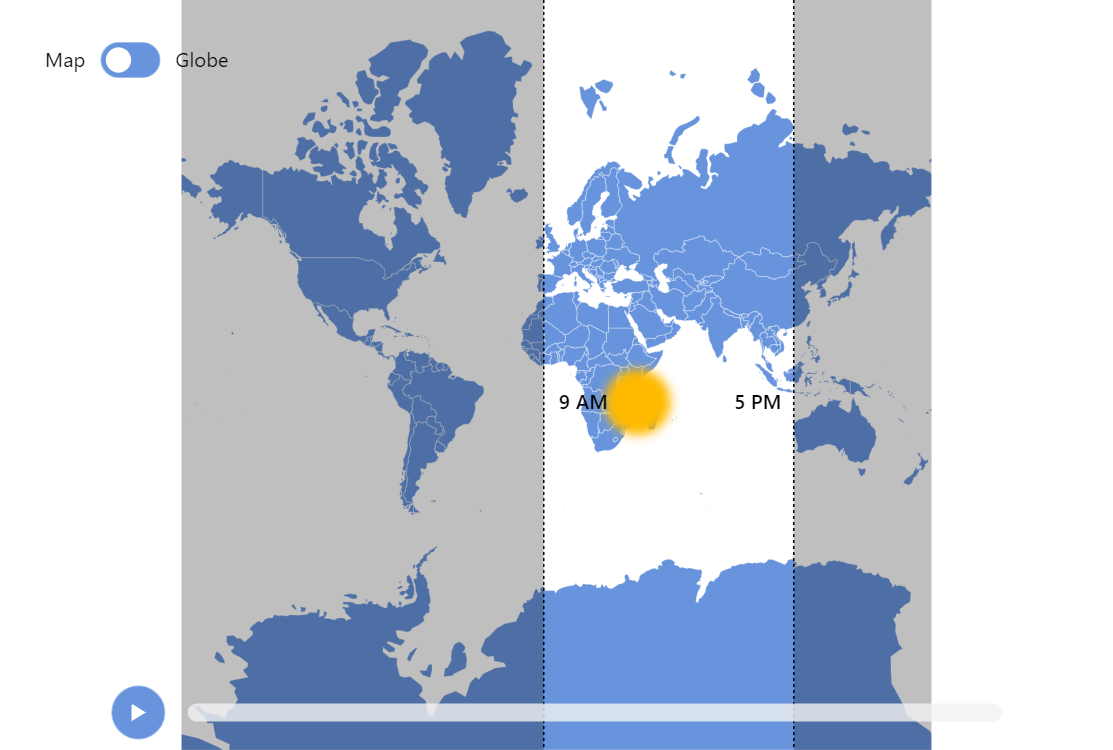
Approximate Working Hours Map
This demo showcases a way to highlight a specific time band on a map. In this specific case we display areas where it is working hours at the moment based on current time.
Key implementation details
The sun is a couple of bullets on a MapPointSeries: one represents a pulsating blurred outer edge, and the other is the static center on top of it.
We highlight the day region by covering the night areas with semi-transparent polygons in MapPolygonSeries.
Related tutorials
Build this chart with AI
The prompt below can be used to build this chart with AI. For best coding results, use the most advanced AI models, like Claude Opus 4.6 and GPT-5.3-Codex. For more info and tips, check out amCharts AI docs.
Create an interactive world map that shows approximate working hours zones (9 AM to 5 PM) based on current solar time. Use a dark background with a yellow pulsating sun icon with a glow effect at the calculated solar position. Render a semi-transparent black overlay for night regions. Draw dashed white lines marking the 9 AM and 5 PM boundaries. Use solar position calculations for real-time accuracy. Add a play/pause button and a horizontal slider for manual time adjustment. Include a Map/Globe toggle switching between flat and 3D projections with adaptive pan/rotate controls. Animate the sun with a pulsating effect in repeating loops. Show country name tooltips. Animate on load. Use amCharts 5 library.
Demo source