Area with Time Based Data
This demo shows you how to create a time-based area chart with amCharts 5.
Key implementation details
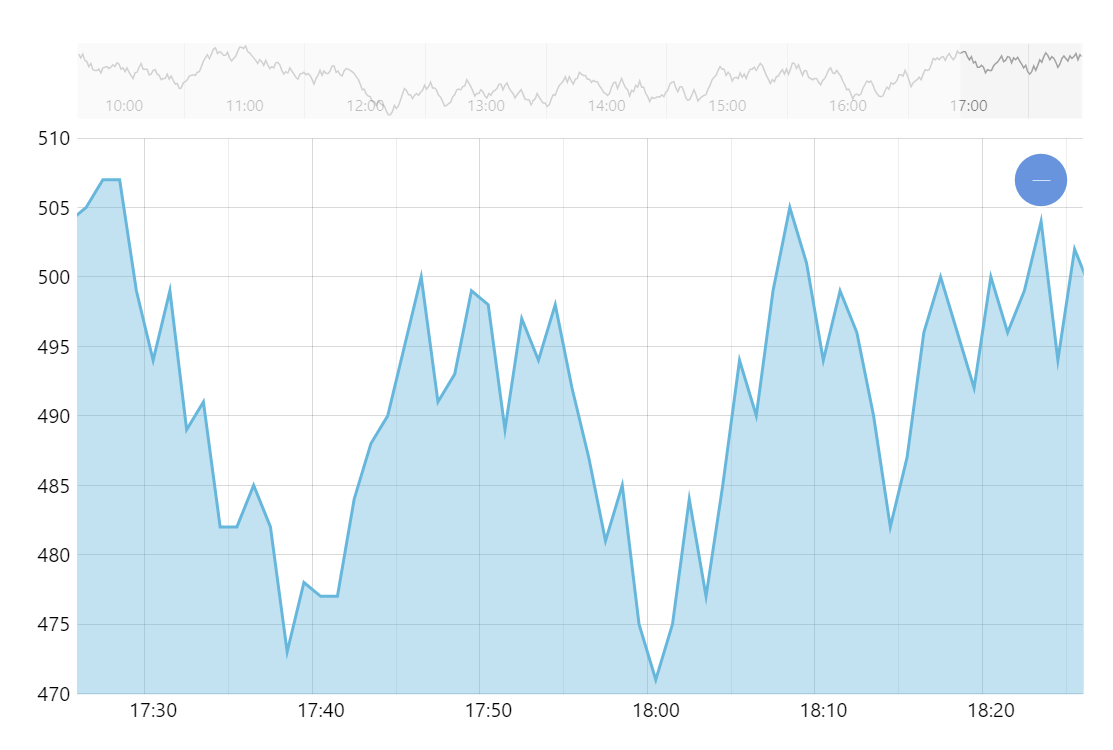
We create an XY chart with DateAxis as its X axis. The base interval on it is set to minutes, as this is the type of data we have. We add a LineSeries to the chart and set its fills.template to visible so we get an area chart as a result.
Related tutorials
Build this chart with AI
The prompt below can be used to build this chart with AI. For best coding results, use the most advanced AI models, like Claude Opus 4.6 and GPT-5.3-Codex. For more info and tips, check out amCharts AI docs.
Create an area chart with 500 minute-level data points and a semi-transparent fill. On load, auto-zoom to show only the final hour of data. Include horizontal tooltips with date/time and value, XY cursor, pan/zoom on both axes including vertical mouse-wheel zoom, horizontal scrollbar, and minor grid lines. Animate on load. Use amCharts 5 library.
Demo source