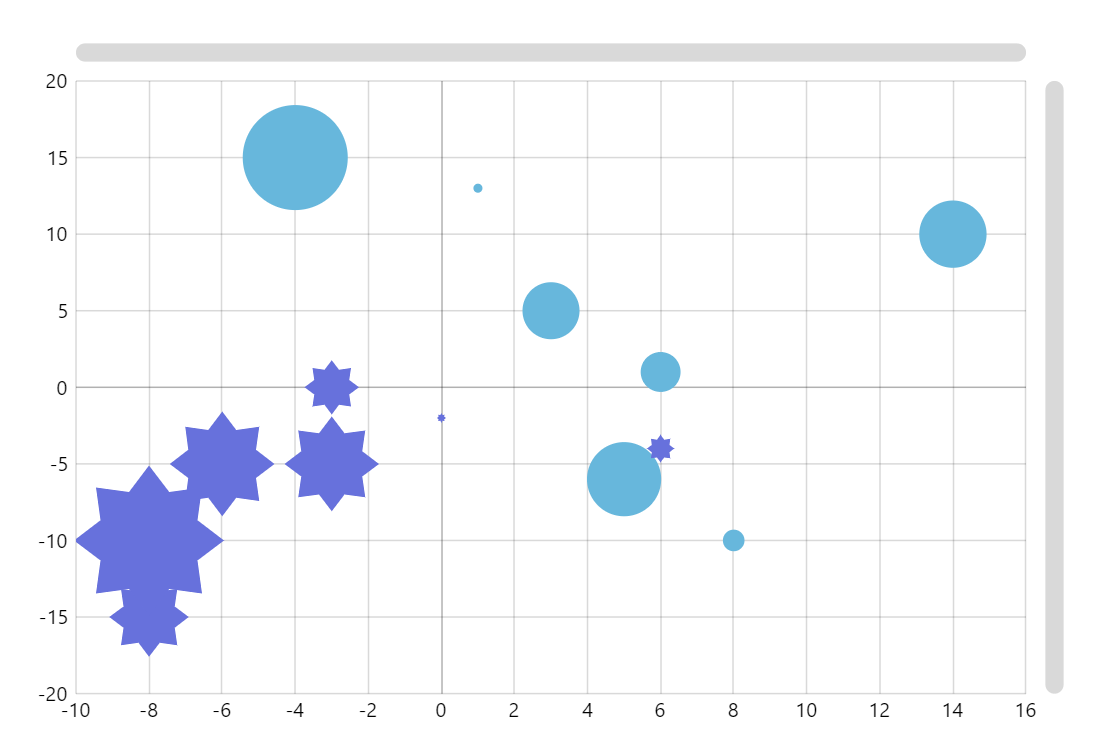
Bubble Chart
Bubble chart displays three dimensions of data: 2 dimensions are represented by the x,y position of the data point, and the third one is represented by its size.
Related tutorials
Build this chart with AI
The prompt below can be used to build this chart with AI. For best coding results, use the most advanced AI models, like Claude Opus 4.6 and GPT-5.3-Codex. For more info and tips, check out amCharts AI docs.
Create a bubble chart with two data series on an XY plot using value axes. Series 0 displays circles with variable size and Series 1 displays eight-pointed star shapes with variable size, both sized based on a value field so that larger values produce larger markers. Use 7 data points with x, y, and value fields for each series. Enable pan on both axes, mouse wheel zoom, and pinch zoom. Add a crosshair cursor snapping to both series with tooltips showing x, y, and value. Include horizontal and vertical scrollbars. Animate both series on load. Use amCharts 5 library.
Demo source