Chord Diagram
Chord Diagrams (also known as Radial network diagram, Chord layout, Dependency wheel) help us visualize relationships between data arranged beautifully in a circle. You can use Chord Diagrams to visualize data ranging from relationships between Lost characters to Uber rides between neighborhoods in a city to complex scientific subjects that are even hard to pronounce.
amCharts 5 includes powerful tools to create your own interactive Chord diagrams and other Flow charts.
Build this chart with AI
The prompt below can be used to build this chart with AI. For best coding results, use the most advanced AI models, like Claude Opus 4.6 and GPT-5.3-Codex. For more info and tips, check out amCharts AI docs.
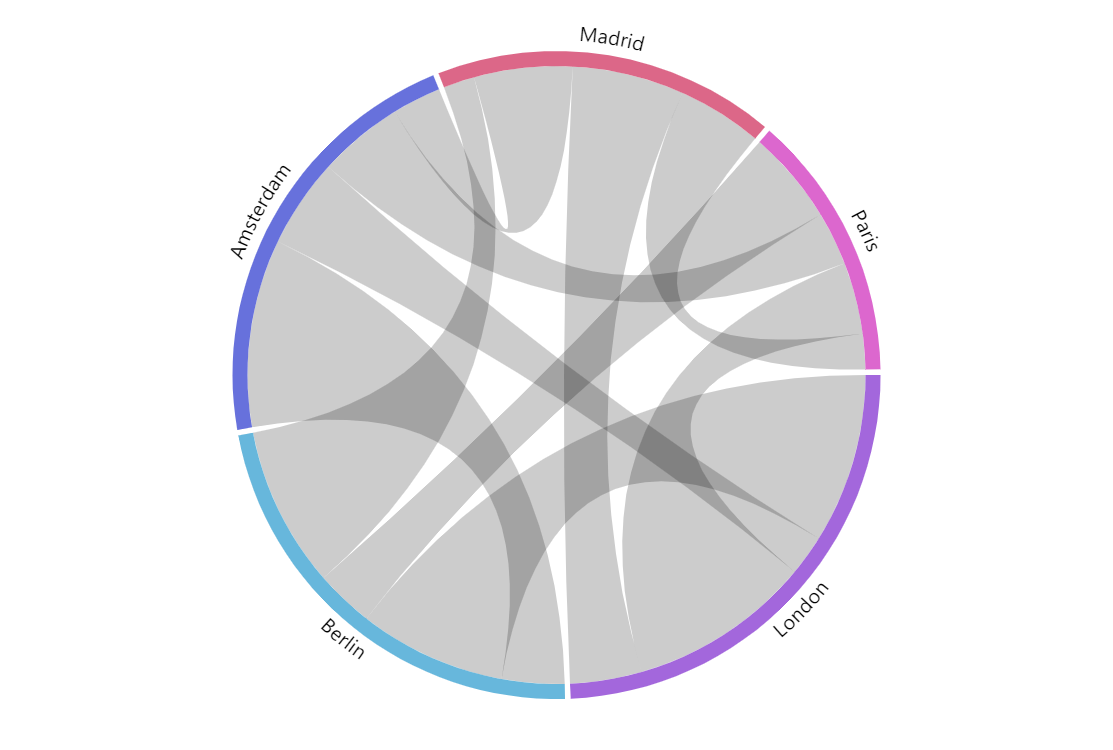
Create a chord diagram visualizing bidirectional flow relationships between European cities: Berlin, Amsterdam, London, Paris, and Madrid. Each data entry specifies a source city, target city, and numeric value representing flow magnitude (showing asymmetric relationships, e.g., Berlin to Amsterdam = 14, Amsterdam to Berlin = 42). Arrange cities around a circular perimeter connected by ribbon-shaped chords whose width is proportional to flow values. Use distinct colors to differentiate city nodes. Use the Animated theme. The chart should be 500px tall at full width. Use amCharts 5 library.
Demo source