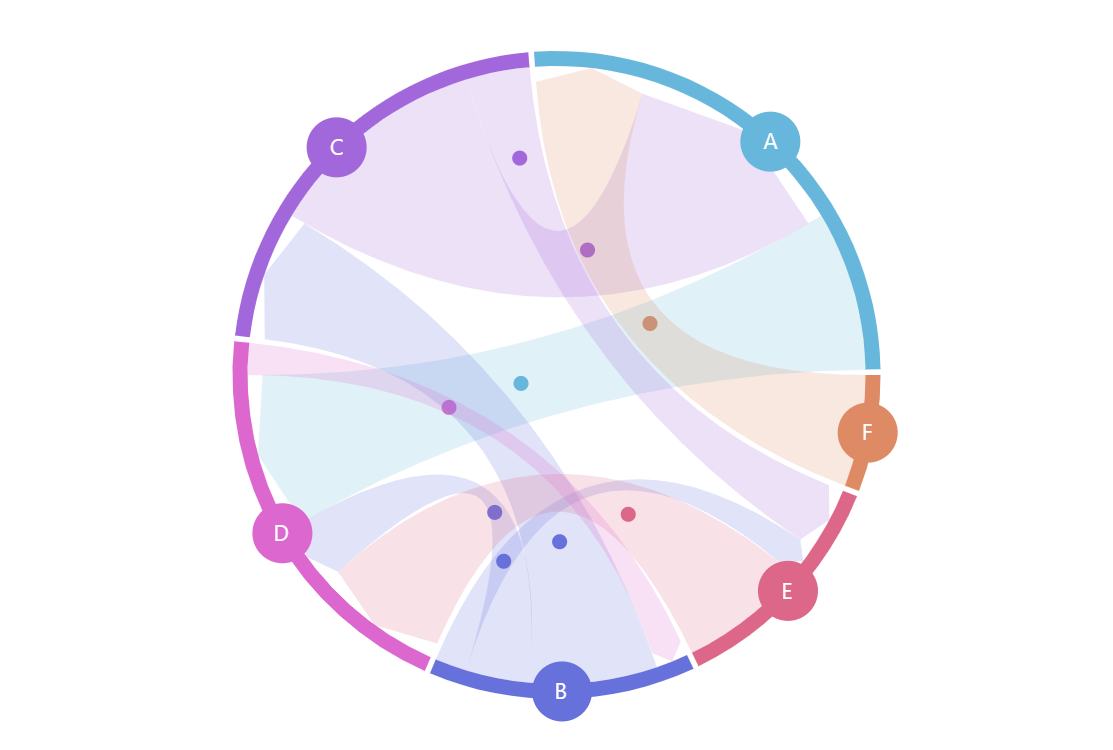
Chord Diagram with Animated Bullets
Animations help direct viewer’s attention and, in the case of the directed chord diagram, emphasize the direction of the data flow.
Key implementation details
Bullets have locationX and locationY properties which indicate relative position of the bullet within the target element (accepted values are between 0 and 1). So, all we need to do is add a bullet to each data item and animate its locationY value from 0 to 1 in a loop.
Related tutorials
Build this chart with AI
The prompt below can be used to build this chart with AI. For best coding results, use the most advanced AI models, like Claude Opus 4.6 and GPT-5.3-Codex. For more info and tips, check out amCharts AI docs.
Create a directed chord diagram with animated bullets traveling along the links to emphasize flow direction. Define 6 nodes (A-F) connected by 9 directional links with weighted values. Position nodes as colored circles around a circular layout with a stepped color palette. Display node labels in white with small circles. Color links to match their source nodes. Sort links in ascending order. Add animated small circles that travel along each link continuously in loops, with varying speeds and staggered starting positions for a lively effect. Animate the chart load with a smooth staggered animation. The chart should be tall at full width. Use amCharts 5 library.
Demo source