Combined Bullet/Column and Line Graphs with Multiple Value Axes
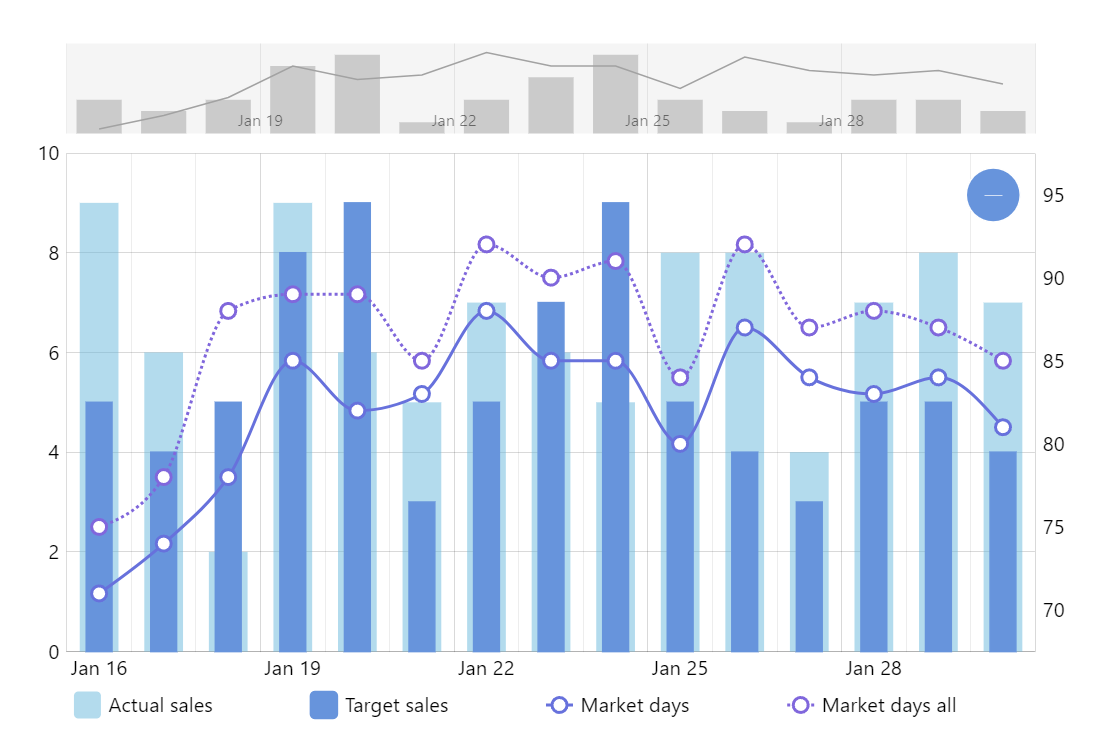
The XYChart is a universal chart type covering most of all of your two-dimensional charting needs. It can also have multiple value axes to represent dramatically different series in a nice readable chart. In this demo we plot two column series and two line series with two value axes.
Key implementation details
We create two value axes and position them on the opposite sides of the plot area. To do that we set opposite: true on the renderer of the second axis. When creating our column series we set there yAxis: yAxis0 (our first value axis) and on the line series we set the yAxis to yAxis1.
Related tutorials
Build this chart with AI
The prompt below can be used to build this chart with AI. For best coding results, use the most advanced AI models, like Claude Opus 4.6 and GPT-5.3-Codex. For more info and tips, check out amCharts AI docs.
Create a chart combining two column series and two line series with dual vertical axes. Use daily date data spanning 15 days with four metrics: two sales values on the left axis shown as semi-transparent columns, and two market values on the right axis shown as smoothed lines with circular markers. Make the second line series dashed for visual distinction. Hide grid lines on the second vertical axis. Add a horizontal crosshair cursor, a scrollbar with a mini preview chart, mouse-wheel horizontal zoom, tooltips showing series names and values, and a centered legend. Animate all series on load with staggered timing. Use amCharts 5 library.
Demo source