Drag-ordering of Bars
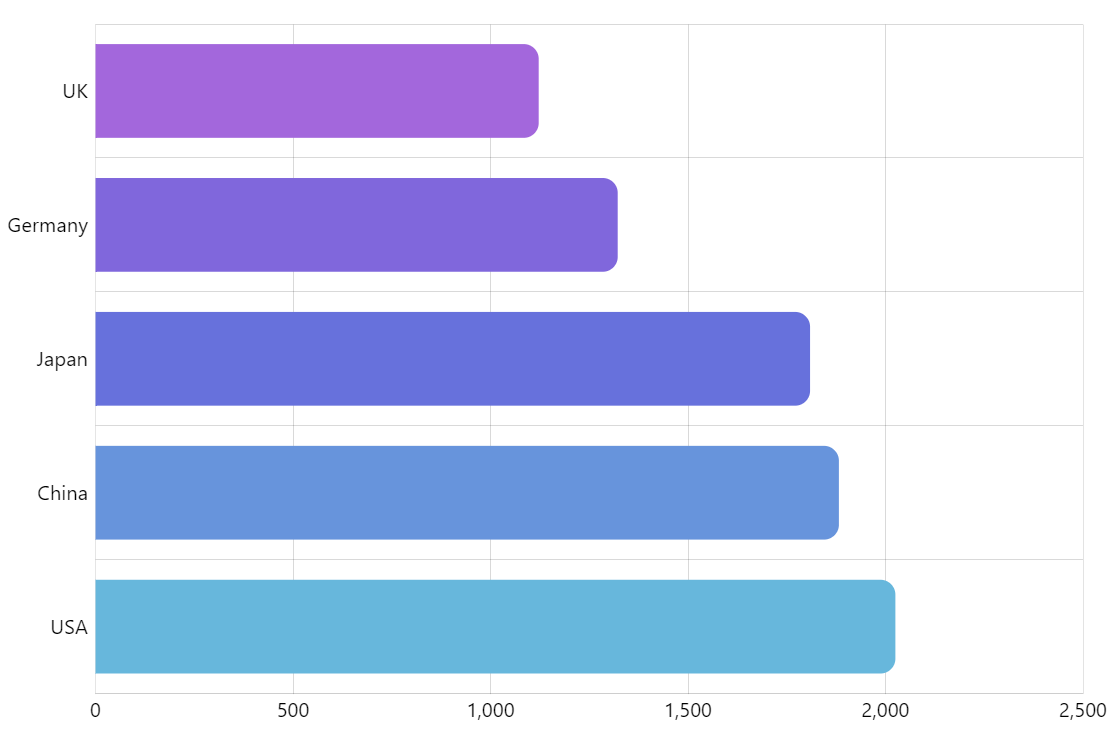
While data visualization is the primary function of amCharts, you can also use its interactive features to let end-users adjust the charts how they see fit. In this example, viewers can re-arrange the order of bars in the chart.
Key implementation details
First, we set draggable: true on our column’s template. This, as the name suggests, makes columns react to dragging. Then, when the pointer is released, we just have to sort bars based on their physical position on screen. We add an event handler for the dragstop event on the column template.
Sorting is done by getting bar’s Graphics object (the one directly responsible for drawing the visual) and calling its y() function to get its vertical position in the chart at the time mouse button was released.
Related tutorials
Demo source