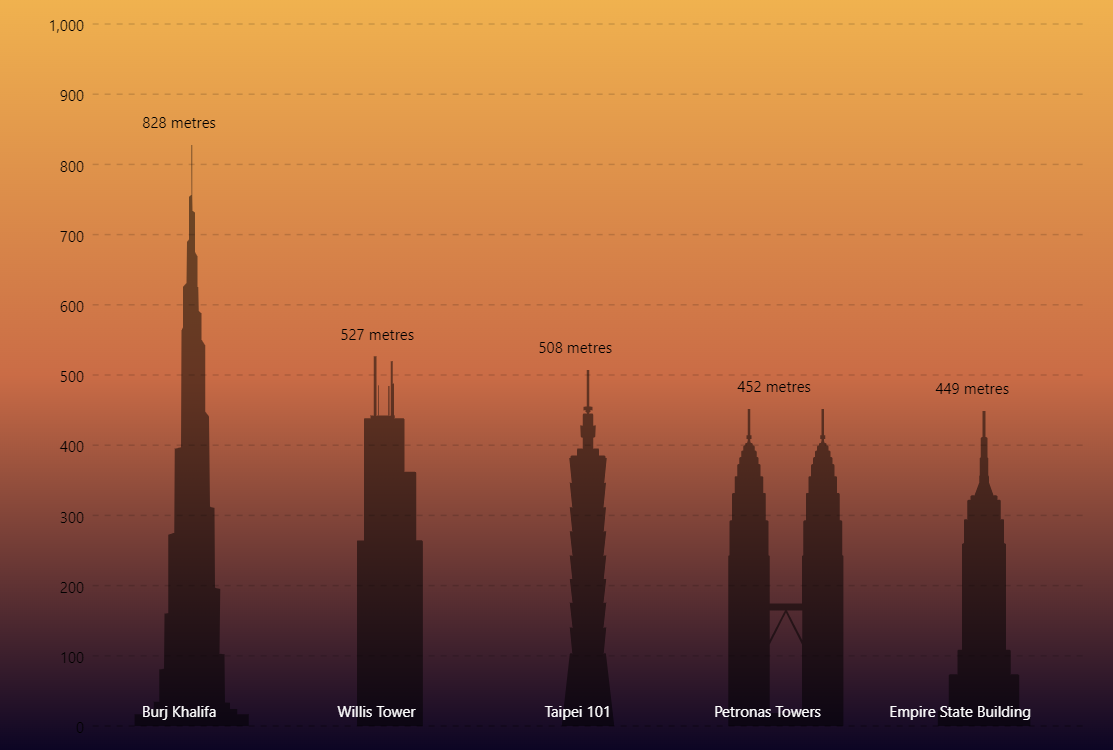
Pictorial Column Chart
Pictorial Column Chart (also known as Pictorial Bar Chart) is a visually spiced up version of a regular bar chart using images to display bars. It is harder to compare values in a pictorial chart but it could be much easier to identify objects portrayed when their shape has a distinct recognizable meaning (like in this demo).
Key implementation details
In this demo, we create a column chart, but we set the opacity of its actual columns to zero. Instead, we use bullets to render images in place of the columns representing values in the chart. We scale the images by calculating the height of the “invisible” columns.
Related tutorials
Demo source