Draggable Range with a Close Button
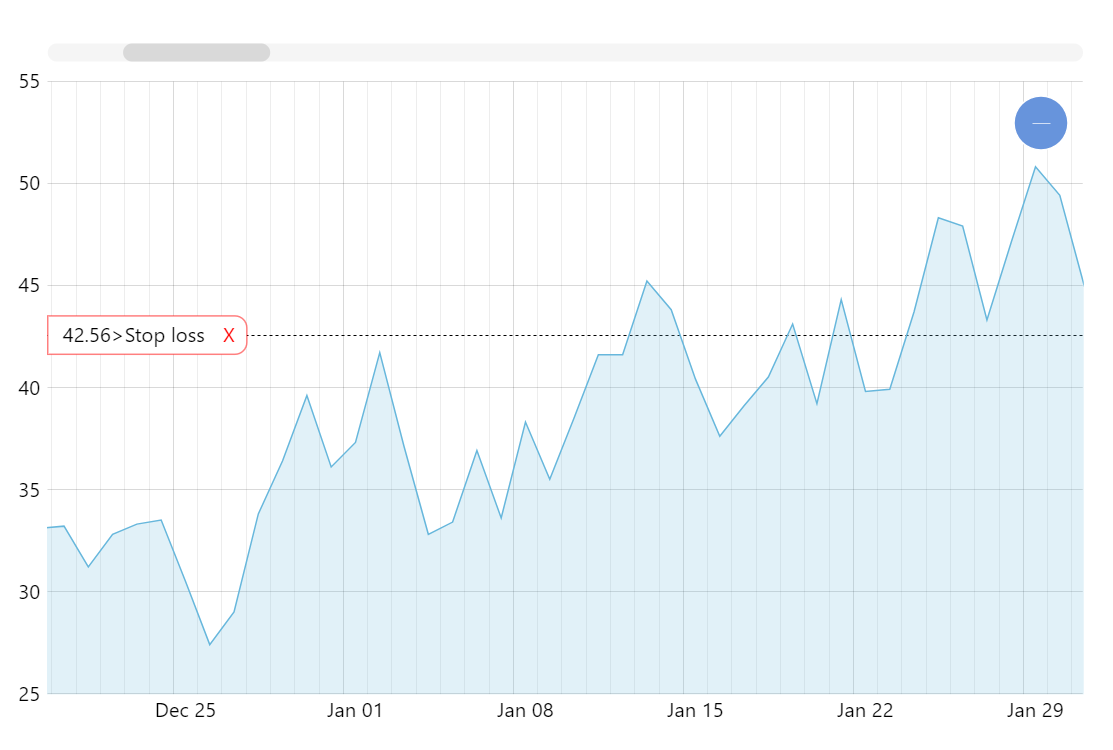
A very common use-case with line and area charts is having some sort of visual indicator to be able to easily see parts of the series going over (or below) some specific value. It is very easy to implement with amCharts’ axis range feature. But we can go one step further and allow the viewer to adjust the indicator value. Try dragging the “Stop loss” indicator box up and down.
Key implementation details
We create an axis range and place a container inside of its bullet to hold our UI elements. Then we add a rounded rectangle, a label, and a close button to the container. Finally, we attach an event handler to the container’s dragged event and update our range position and label value accordingly.
Related tutorials
Build this chart with AI
The prompt below can be used to build this chart with AI. For best coding results, use the most advanced AI models, like Claude Opus 4.6 and GPT-5.3-Codex. For more info and tips, check out amCharts AI docs.
Create a line chart with 300 daily data points (values 0-100) featuring a draggable stop-loss indicator: a small labeled panel with red border showing the current value and 'Stop loss' text, connected to a red dashed horizontal reference line. Include a close button to remove the indicator. Add filled area beneath the line, pan/zoom, XY cursor, tooltips, horizontal scrollbar, and entrance animation. Use amCharts 5 library.
Demo source