Drawing Chart Series with Mouse or Touch
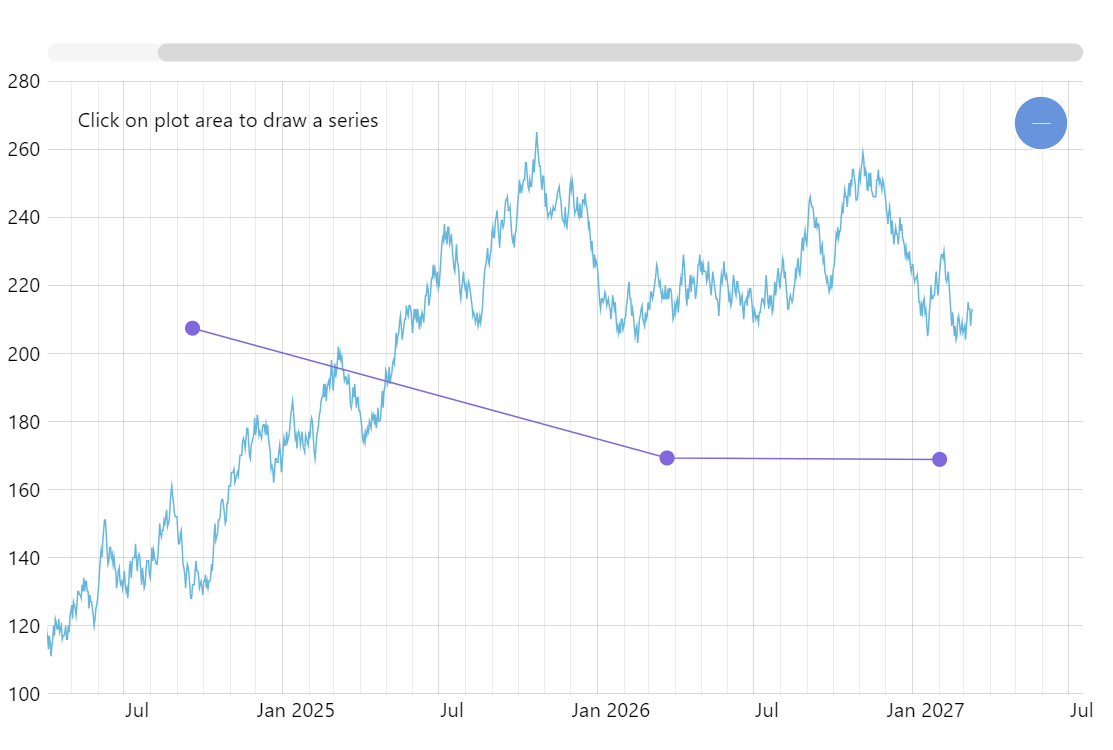
Your charts don’t have to be limited to passively displaying data. You can use amCharts as an interactive chart creation surface and enable your users to visually draw new charts. Click anywhere on plot area to draw the new series, drag bullets to adjust positions.
Related tutorials
Build this chart with AI
The prompt below can be used to build this chart with AI. For best coding results, use the most advanced AI models, like Claude Opus 4.6 and GPT-5.3-Codex. For more info and tips, check out amCharts AI docs.
Create a line chart with 1,200 daily data points that allows users to click on the plot to place new points forming a second drawn series. Each user-placed point has a draggable circular handle for repositioning. Auto-sort drawn points by date to maintain line continuity. Display instructional text. Include a crosshair cursor, pan/zoom, horizontal scrollbar, tooltips, and entrance animation. Use amCharts 5 library.
Demo source