Drill-Down Sunburst Chart
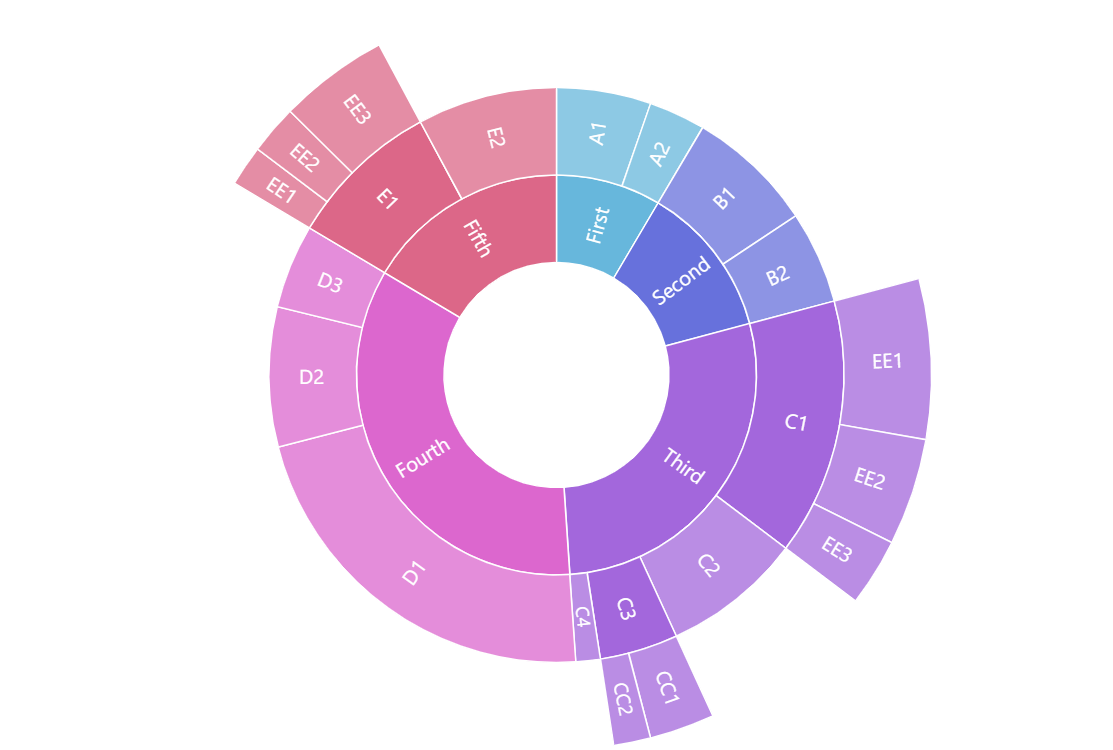
Sunburst Chart or Diagram represents hierarchical relational data in a circular chart. It looks similar to nested donut charts, however, the hierarchical nature of the Sunburst means that each level represents detalization of the previous one. In other words, children slices on each level comprise the whole of the parent slice.
The amCharts Sunburst chart supports drilling down right out of the box with no additional configuration needed. Clicking on any value with children will drill the chart down to this value in the center and its children on the outside.
Key implementation details
Sunburst chart is part of the hierarchy module of the amCharts Charts package. To create a Sunburst chart we add a Container to the page and then push a new Sunburst object into it. Then we just configure categoryField, valueField, and childDataField on the Sunburst.
Related tutorials
Build this chart with AI
The prompt below can be used to build this chart with AI. For best coding results, use the most advanced AI models, like Claude Opus 4.6 and GPT-5.3-Codex. For more info and tips, check out amCharts AI docs.
Create a drill-down sunburst chart displaying hierarchical data as concentric rings in a circular layout. Use nested data with five primary categories (First through Fifth), each containing multiple levels of children with numeric values, some branches extending three levels deep. Set a hollow center. Enable drill-down: clicking a segment with children should center that segment and display its children in outer rings. Apply color differentiation for visual distinction between segments. Animate the series on load with a smooth staggered animation. The chart should be tall at full width. Use amCharts 5 library.
Demo source