Drill-Down Treemap
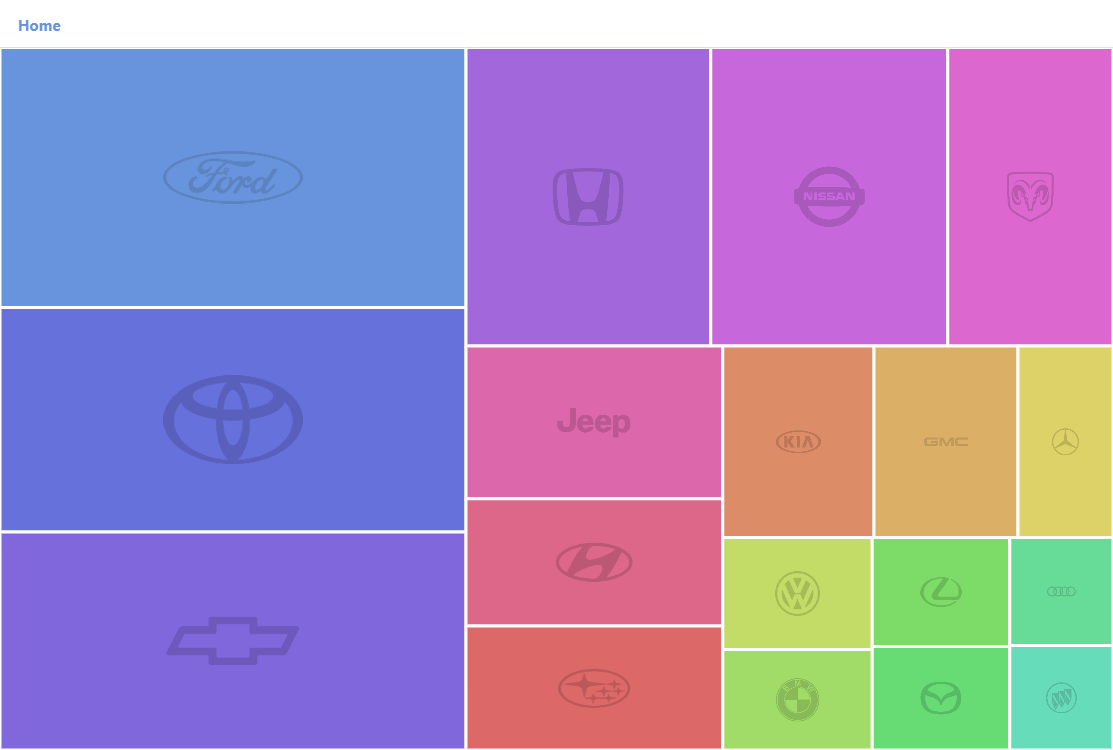
Drill-Down Treemap is a great way to cleanly display high-level information without losing the ability to analyze the underlying details. Try clicking on one of the squares to see the sales of different models of that brand. You can also compare this demo to the multi-level treemap demo where the same data is displayed in full detail from the get-go.
Key implementation details
To make Treemap display only the first level on load we set its initialDepth to 1. In a drill-down chart it is also a good idea to provide a way to get back to a higher level. In this demo we use BreadcrumbBar for the commonly implemented breadcrumb navigation functionality.
Related tutorials
Build this chart with AI
The prompt below can be used to build this chart with AI. For best coding results, use the most advanced AI models, like Claude Opus 4.6 and GPT-5.3-Codex. For more info and tips, check out amCharts AI docs.
Create a drill-down treemap displaying automotive sales data organized in three hierarchical levels: a root node, car manufacturer brands, and individual vehicle models with sales figures. Filter to only show brands with high total sales and models with meaningful sales numbers. Add a breadcrumb navigation bar at the top for hierarchical context. Style brand-level rectangles with visible borders; model-level rectangles with subtle, semi-transparent borders. Hide brand-level labels; show small labels at the model level. Display faint brand logos as background imagery. Clicking any rectangle drills down one level. Apply color gradients with stepping per hierarchy level. The chart should be tall at full width. Use amCharts 5 library.
Demo source