Zoomable Multilevel Tree Map
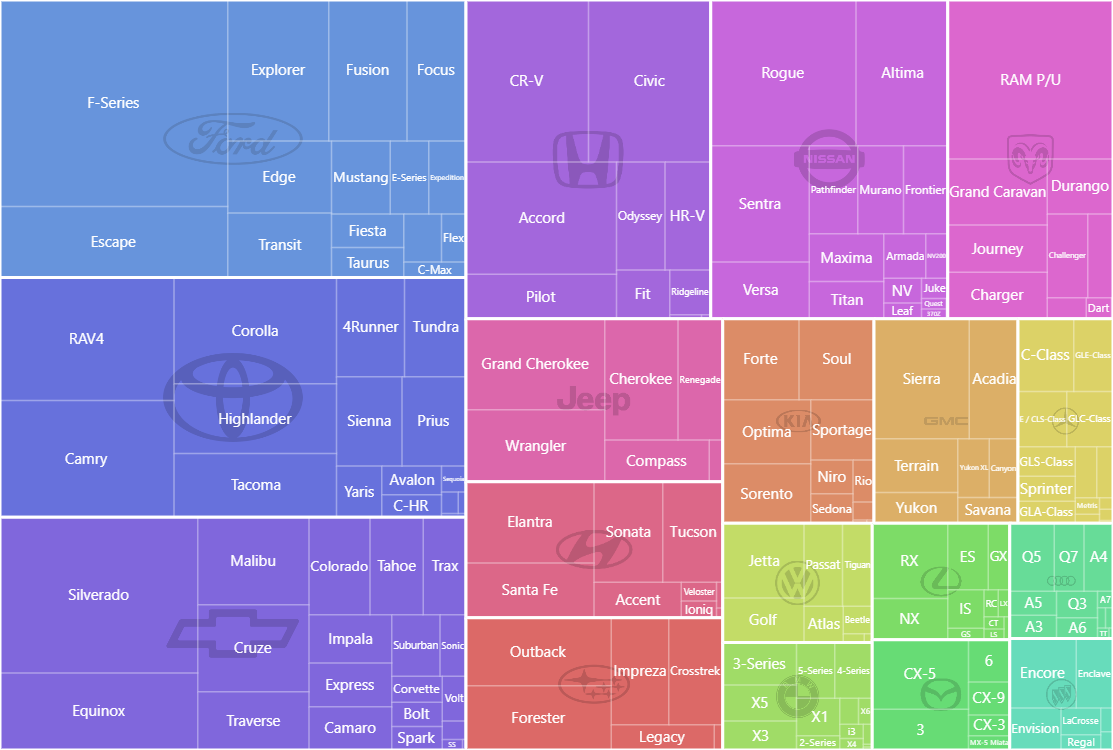
In a Tree Map the rectangle is divided into smaller rectangles with their size representing the value of each data item. Those smaller rectangles can in turn be divided into even smaller ones creating a sub-treemap.
Key implementation details
Treemap is part of the hierarchy module of amCharts. We configure all the data fields on the Treemap and set its initialDepth to 2 to display two levels of data. We then process our dataset into a structure suitable for a hierarchy chart. And, finally, we add logos as bullets for the top level items.
This chart is added to a Zoomable Container, so you can pan, zoom-in and zoom-out this chart using mouse wheel, pinch-zoom or zoom tools on the bottom-right.
Related tutorials
Build this chart with AI
The prompt below can be used to build this chart with AI. For best coding results, use the most advanced AI models, like Claude Opus 4.6 and GPT-5.3-Codex. For more info and tips, check out amCharts AI docs.
Create a zoomable multilevel treemap displaying automobile sales data organized by manufacturer and model. Filter to only show brands with high total sales and exclude models with very low sales. Use three hierarchy levels: root, car brands, and individual models. Style brand-level rectangles with visible borders; model-level rectangles with subtle, semi-transparent borders. Hide labels at the brand level and show small labels at the model level. Display faint brand logos as background imagery in each manufacturer section. Wrap the chart in a zoomable container with mouse wheel zoom, pinch-zoom, and zoom controls in the bottom-right. Clicking a model navigates to its parent brand. Sort in descending order with the largest values first. Apply color gradients with stepped differentiation. The chart should be tall at full width. Use amCharts 5 library.
Demo source