Sunburst Chart
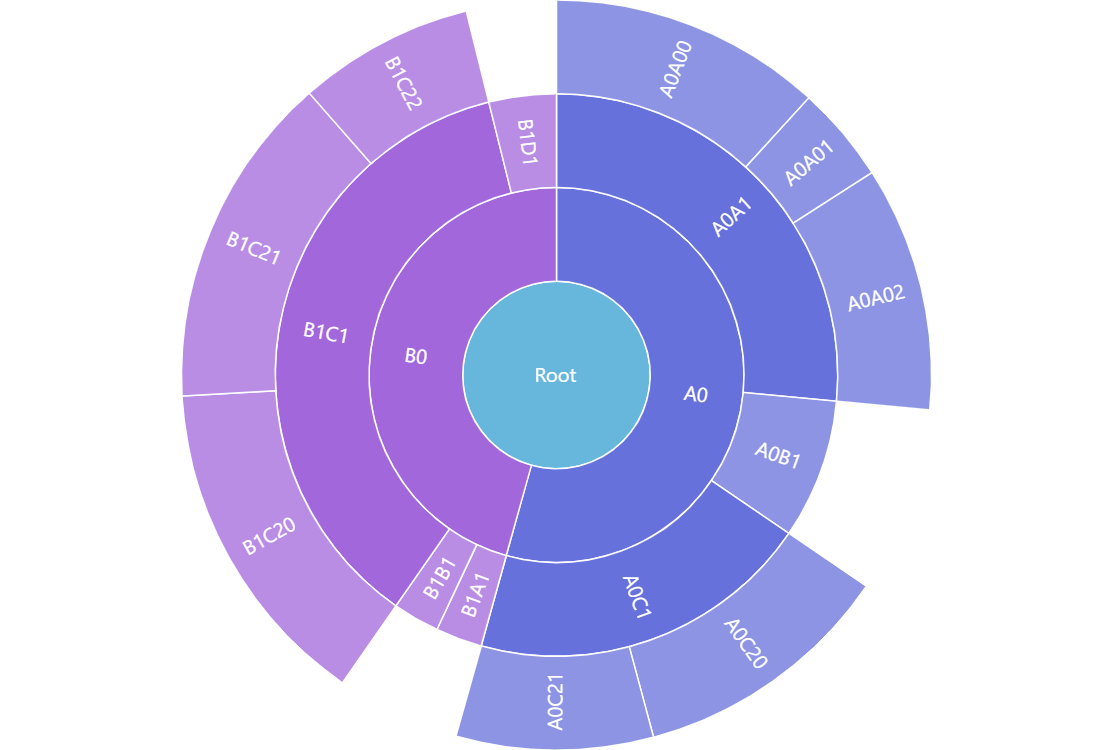
Sunburst Chart or Diagram represents hierarchical relational data in a circular chart. It looks similar to nested donut charts, however, the hierarchical nature of the Sunburst means that each level represents detalization of the previous one. In other words, children slices on each level comprise the whole of the parent slice.
Related tutorials
Build this chart with AI
The prompt below can be used to build this chart with AI. For best coding results, use the most advanced AI models, like Claude Opus 4.6 and GPT-5.3-Codex. For more info and tips, check out amCharts AI docs.
Create a sunburst chart that displays hierarchical data as concentric rings in a circular layout. Generate random hierarchical data with a root node, up to 2 levels deep, up to 3 nodes per level, and values from 0 to 100. Each ring level represents a deeper hierarchy level, with child segments composing portions of their parent slices. Apply distinct color coding for different branches. Enable click-based drill-down navigation. The selected data item should highlight on initialization. Animate the series with a smooth staggered animation. The chart should be tall at full width. Use amCharts 5 library.
Demo source