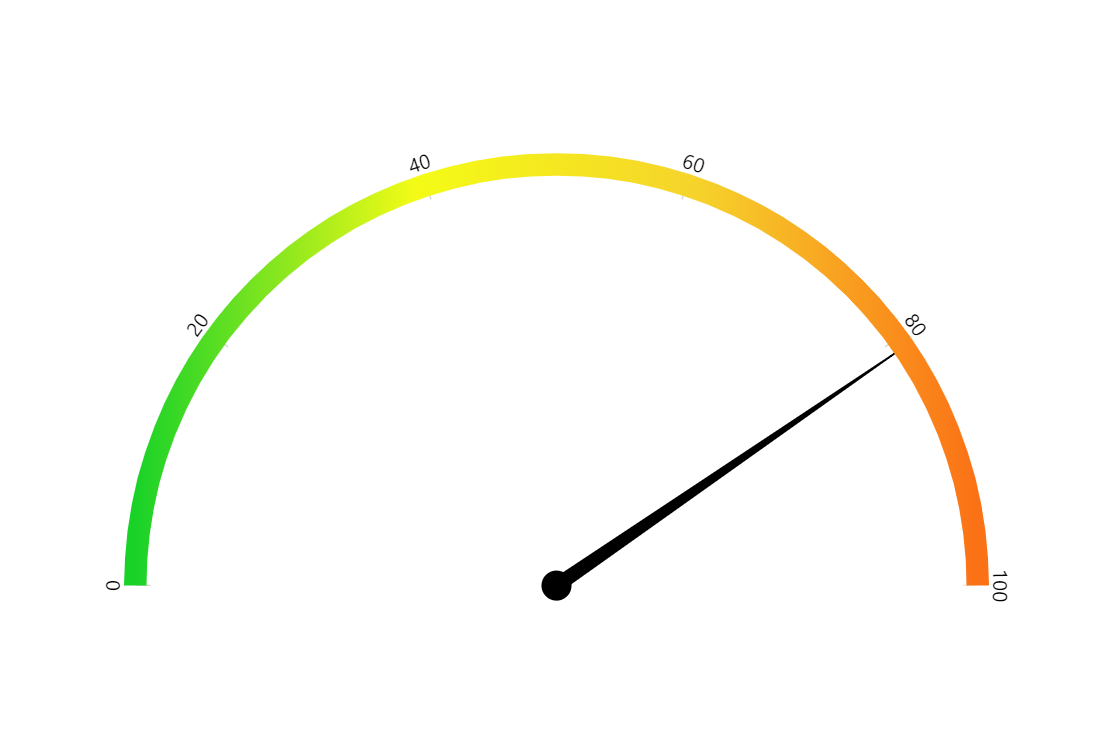
Gauge with Gradient Fill
It is very common for physical gauges to have a scale from safe to dangerous values, for example. This scale is usually accompanied with a gradient color band going from green to red. You can easily achieve the same with amCharts Gauge Chart.
Key implementation details
We create the gradient fill by configuring the axis renderer for our value axis. We use a circular axis renderer (AxisRendererCircular) for that and set its strokeGradient to a LinearGradient. Stroke width of 15 creates the feeling of a “fill”.
Related tutorials
Build this chart with AI
The prompt below can be used to build this chart with AI. For best coding results, use the most advanced AI models, like Claude Opus 4.6 and GPT-5.3-Codex. For more info and tips, check out amCharts AI docs.
Create a semicircular gauge chart with a value range of 0 to 100. Apply a gradient color band along the circular arc that transitions through four colors: green, yellow, gold, and orange, representing a safe-to-dangerous spectrum. Make the arc thick and prominent. Add a needle that rotates to the current value. Auto-update with random values between 0 and 100 every 2 seconds, animating the needle with smooth animation. Include a fade-in chart appearance animation on load. Use amCharts 5 library.
Demo source