Infographic
While amCharts libraries are most commonly used in advanced data visualization scenarios, their flexibility enables us to implement more of a storytelling scenarios as well.
Key implementation details
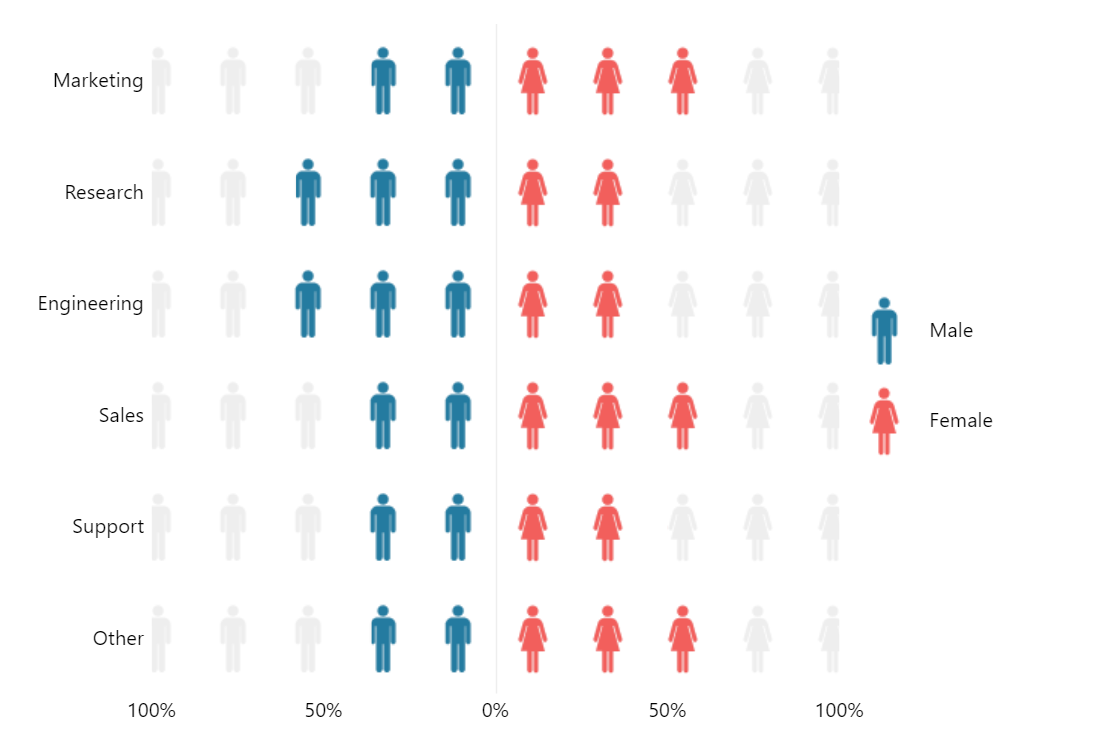
What you see is actually a column chart (with horizontal columns). The main trick here is that we use icons as a fillPattern for the columns.
Related tutorials
Build this chart with AI
The prompt below can be used to build this chart with AI. For best coding results, use the most advanced AI models, like Claude Opus 4.6 and GPT-5.3-Codex. For more info and tips, check out amCharts AI docs.
Create an infographic-style horizontal bar chart showing gender distribution across departments (Marketing, Research, Engineering, Sales, Support, Other). Male percentages extend left and female percentages extend right from a center zero line, from -100 to 100. Use icon fill patterns instead of solid fills: male icons in blue and female icons in red, with light gray placeholder bars showing maximum capacity. Hide grid lines. Add a vertical legend with large marker icons. Disable pan, zoom, and scroll interactions. Disable tooltips. Animate the chart on load. Use amCharts 5 library.
Demo source