Line with Changing Color
Alternating line color via data
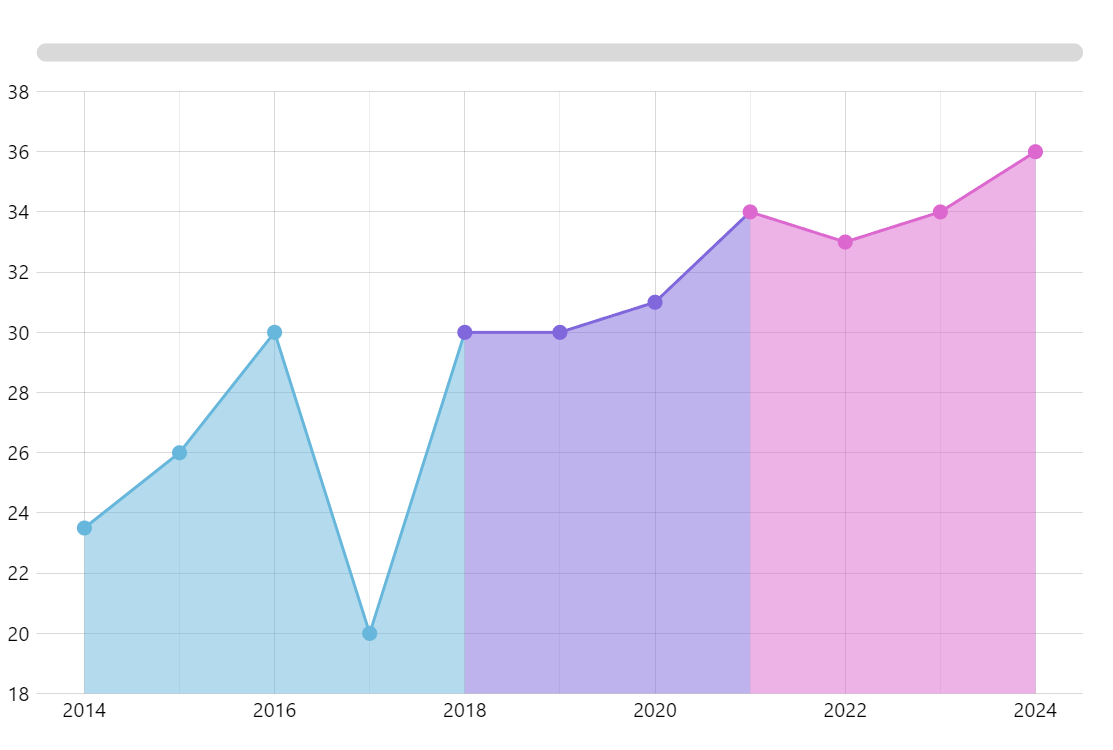
amCharts 5 brings a powerful concept – template fields, which allows binding any setting of a Line series segment to values in data. Once a setting, say a color, is overridden via data, the Line series remembers it and continues coloring subsequent segments in the same color.
Related tutorials
Build this chart with AI
The prompt below can be used to build this chart with AI. For best coding results, use the most advanced AI models, like Claude Opus 4.6 and GPT-5.3-Codex. For more info and tips, check out amCharts AI docs.
Create a line chart with 11 yearly data points (2014-2024) where the line changes color across different segments to highlight distinct phases. Display circular bullets matching each segment's color and a semi-transparent fill beneath the line. Include an XY cursor, minor grid lines, horizontal scrollbar, and tooltips. Animate on load. Use amCharts 5 library.
Demo source