Stacked Area
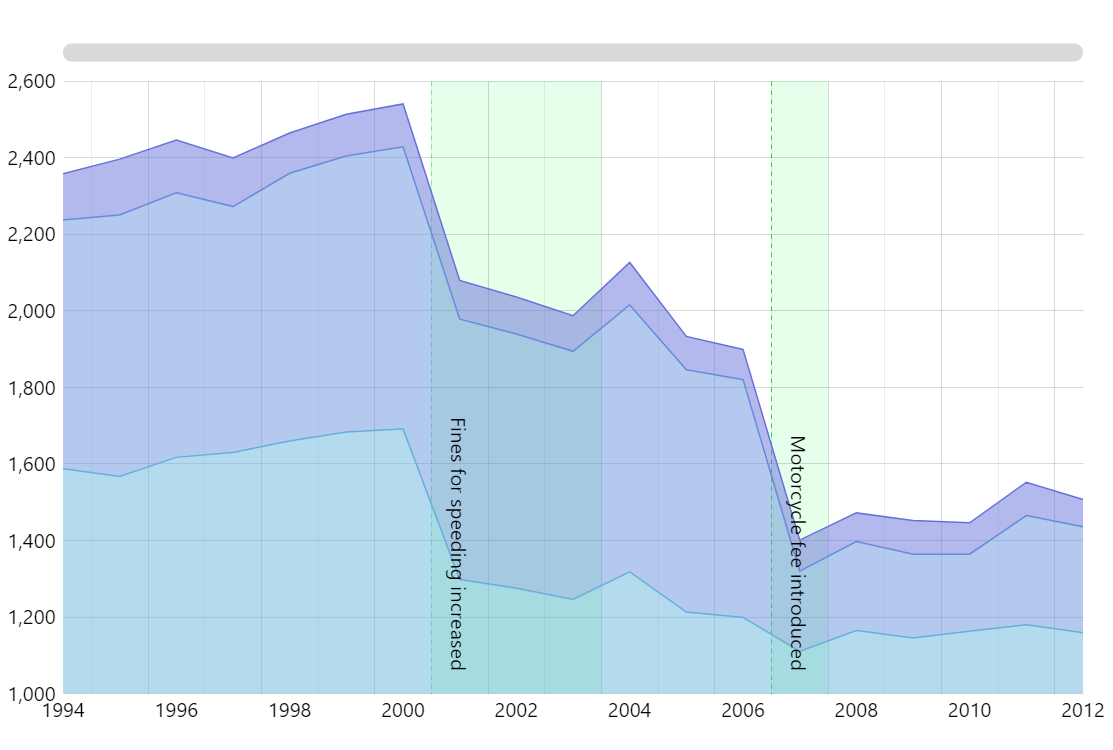
Stacked Area Chart (also known as Stacked Area Plot) is a variation on a simple Area Chart with multiple areas stacked on top of each other. This allows comparing the evolution of the whole as well as contributions of individual parts over a period.
Stacked line series
Line series can easily be stacked by setting a single property: stacked. That’s it – the chart will take care of the rest.
Vertical ranges and guides
Any axis can contain vertical bands or guide lines added, with an optional label, to indicate certain ranges or points in the chart.
More about axis ranges and guides
Build this chart with AI
The prompt below can be used to build this chart with AI. For best coding results, use the most advanced AI models, like Claude Opus 4.6 and GPT-5.3-Codex. For more info and tips, check out amCharts AI docs.
Create a stacked area chart with three series (Cars, Motorcycles, Bicycles) across years 1994-2012 on a category X-axis. Add annotated reference zones with dashed green lines and labels at specific year spans highlighting events (e.g., 'Fines for speeding increased' at 2001-2003). Include horizontal tooltips, XY cursor, pan/zoom, horizontal scrollbar, and entrance animation. Use amCharts 5 library.
Demo source