100% Stacked Area Chart
Using calculated values for series
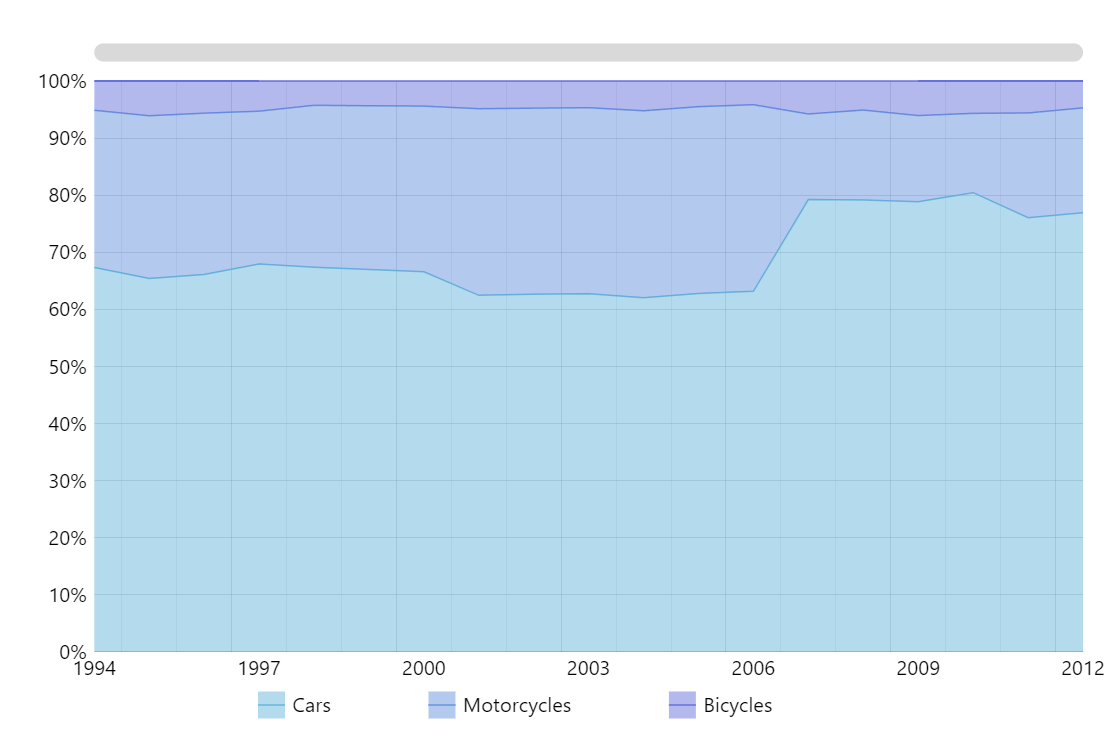
In amCharts 6, Series can be drawn from a variety of auto-calculated values, not necessarily the absolute ones.
In this case, we are setting valueYShow data field to "valueYTotalPercent" which is an auto-calculated value, producing a 100% stack chart.
Related tutorials
Build this chart with AI
The prompt below can be used to build this chart with AI. For best coding results, use the most advanced AI models, like Claude Opus 4.6 and GPT-5.3-Codex. For more info and tips, check out amCharts AI docs.
Create a 100% stacked area chart with three series (Cars, Motorcycles, Bicycles) across years 1994-2012. Normalize values to percentages summing to 100% with percentage-formatted Y-axis. Show tooltips with series name, year, percentage, and absolute value. Include a centered legend, XY cursor, pan/zoom, horizontal scrollbar, and semi-transparent fills. Animate on load. Use amCharts 5 library.
Demo source