Sankey Diagram
Sankey diagram is a perfect chart to show the flow and relation between stages of a process.
amCharts 5 implementation of Sankey diagram allows flexible configuration of nodes and links, dragging and toggling of nodes, as well as some other tricks.
Related tutorials
Build this chart with AI
The prompt below can be used to build this chart with AI. For best coding results, use the most advanced AI models, like Claude Opus 4.6 and GPT-5.3-Codex. For more info and tips, check out amCharts AI docs.
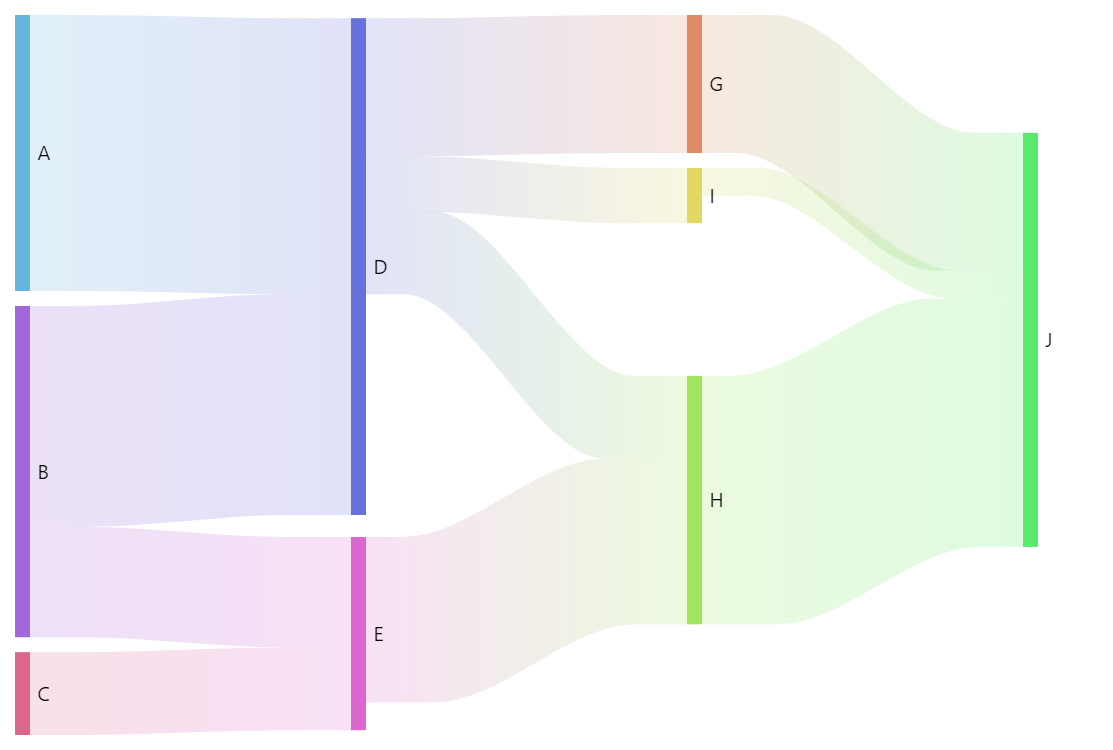
Create a Sankey diagram showing flow connections between process stages. Define source nodes (A, B, C) on the left, intermediate nodes (D, E, G, H, I) in the middle, and a terminal node (J) on the right. Each connection should have a numeric weight representing flow magnitude. Nodes should be displayed as rectangular blocks connected by colored ribbon-shaped links whose width corresponds to flow values. The diagram should automatically arrange nodes vertically to minimize overlap. Apply stepped colors for visual distinction. Enable built-in node dragging and toggling. Animate with a smooth staggered animation. The chart should be tall at full width. Use amCharts 5 library.
Demo source