Vertical Sankey Diagram
Sankey diagram is a perfect chart to show the flow and relation between stages of a process. Horizontal orientation is more common for Sankey diagrams but with amCharts you can create vertical diagrams just as easily.
Key implementation details
Sankey diagram is included in the flow amCharts module. To make the diagram vertical you just need to set its orientation property to "vertical".
Related tutorials
Build this chart with AI
The prompt below can be used to build this chart with AI. For best coding results, use the most advanced AI models, like Claude Opus 4.6 and GPT-5.3-Codex. For more info and tips, check out amCharts AI docs.
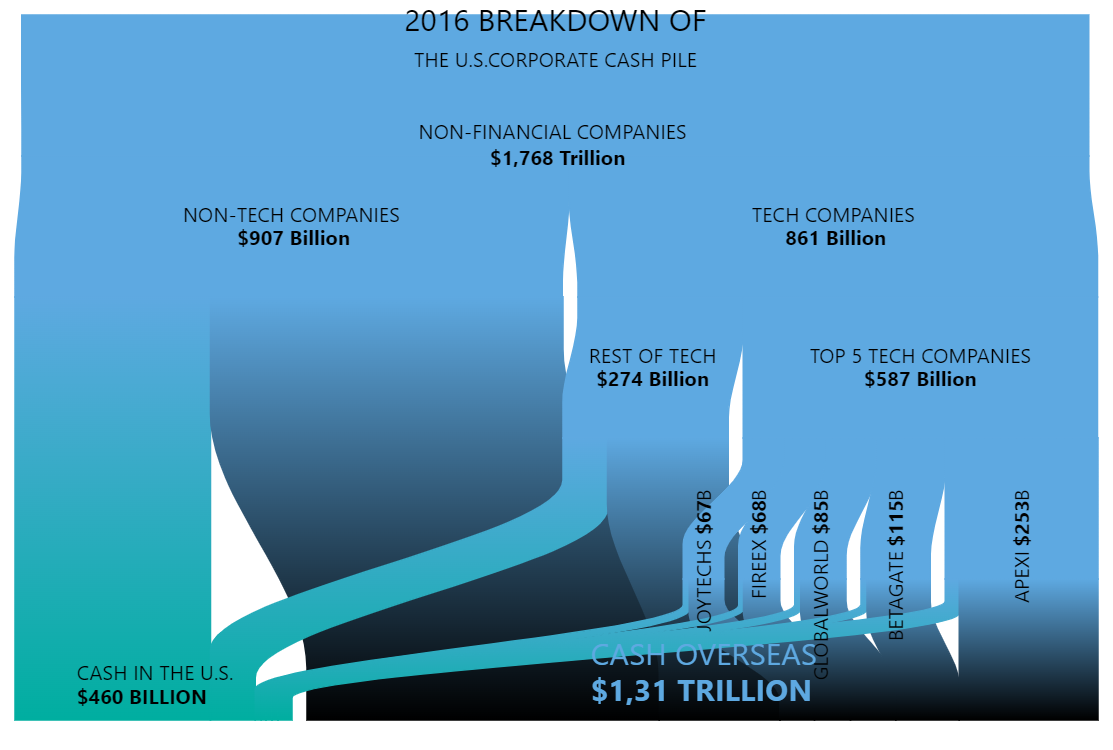
Create a vertical Sankey diagram illustrating U.S. corporate cash distribution in 2016. The flow should start from a total of $1.768 trillion in non-financial company cash, splitting into non-tech ($907B) and tech ($861B), with tech further dividing into 'Rest of tech' ($274B) and 'Top 5 tech companies' ($587B) broken down by company (Joytechs, Fireex, Globalworld, Betagate, Apexi). Final destinations should be 'Cash in the U.S.' ($460B) and 'Cash Overseas' ($1.31T). Style nodes with a teal/blue color with no fill and visible borders. Disable node interactivity but keep links interactive with subtle opacity changes on hover. Disable tooltips. Add custom labels with bold formatting and varied font sizes. Set orientation to vertical. Animate with a smooth staggered animation. The chart should be large and square. Use amCharts 5 library.
Demo source