Traceable Sankey Diagram
Traceable Sankey Diagram is a specific version of the regular Sankey Diagram enabling viewers to see the whole path of some data by hovering over the chart.
Related tutorials
Build this chart with AI
The prompt below can be used to build this chart with AI. For best coding results, use the most advanced AI models, like Claude Opus 4.6 and GPT-5.3-Codex. For more info and tips, check out amCharts AI docs.
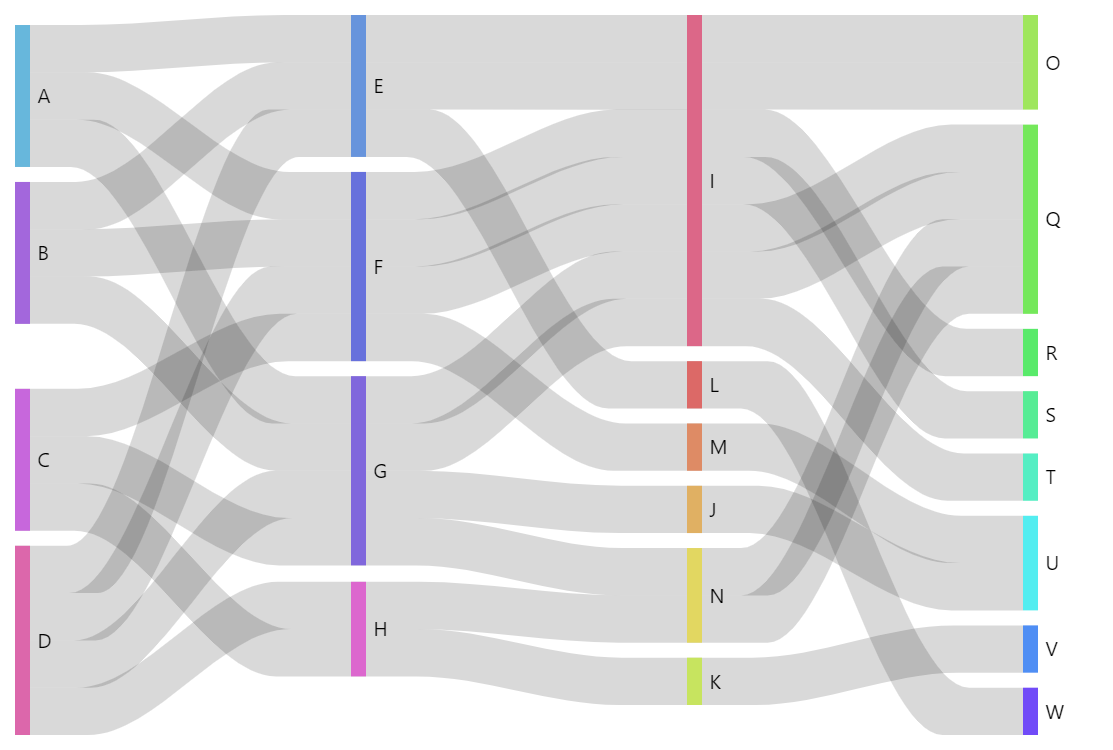
Create a traceable Sankey diagram where hovering over any link highlights the entire path from source to destination. Define flow connections between nodes A through W arranged in multiple vertical columns flowing left to right. Each connection should have a 'from', 'to', 'value', and a unique 'id' field. Links should appear faint by default and become highlighted when hovered. On hover, identify and highlight all links that share the same flow path, allowing viewers to trace the complete path of data flow by hovering over any link segment. Restore links to their faint default appearance when the cursor moves away. Animate with a smooth staggered animation. The chart should be tall at full width. Use amCharts 5 library.
Demo source