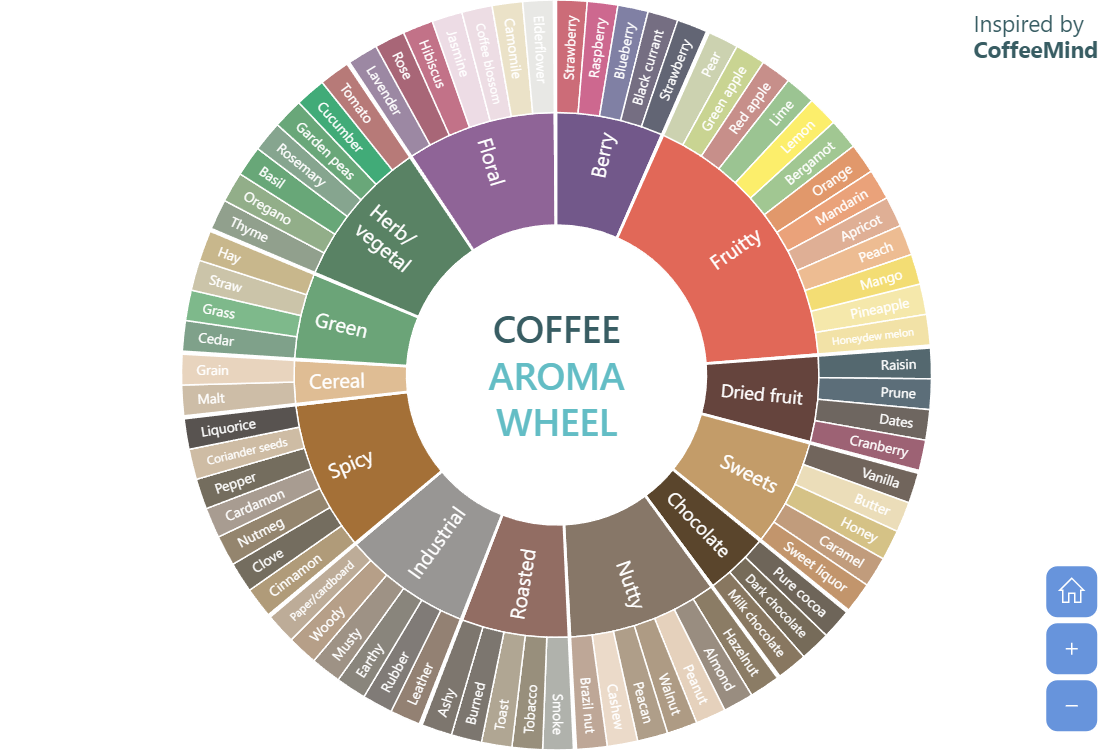
Sunburst Flavor Wheel
The demo shows off two-level Sunburst chart. The data uses all same values because the purpose of this chart is displaying hierarchy of types rather than their quantitative distribution.
We also are using “template fields” technique to assign individual color to each chart via data.
This chart is added to a Zoomable Container, so you can pan, zoom-in and zoom-out this chart using mouse wheel, pinch-zoom or zoom tools on the bottom-right.
Related tutorials
Build this chart with AI
The prompt below can be used to build this chart with AI. For best coding results, use the most advanced AI models, like Claude Opus 4.6 and GPT-5.3-Codex. For more info and tips, check out amCharts AI docs.
Create a sunburst chart styled as a coffee aroma flavor wheel, inspired by the CoffeeMind Aroma Wheel. The root node is 'COFFEE' with 14 primary flavor categories (Berry, Fruity, Dried fruit, Sweets, Chocolate, Nutty, Roasted, Industrial, Spicy, Cereal, Green, Herb/vegetal, Floral) each containing individual flavor descriptors as children. All leaf nodes represent types rather than quantities. Apply unique color palettes per category with distinct shades for child items. Create a hollow donut center. Display a centered label reading 'COFFEE AROMA WHEEL' with teal highlighting. Add a credit label 'Inspired by CoffeeMind' in the upper-right corner. Wrap in a zoomable container with mouse wheel zoom, pinch-zoom, pan, and zoom controls in the bottom-right. Animate with a smooth staggered animation. The chart should be tall. Use amCharts 5 library.
Demo source