Tree Chart
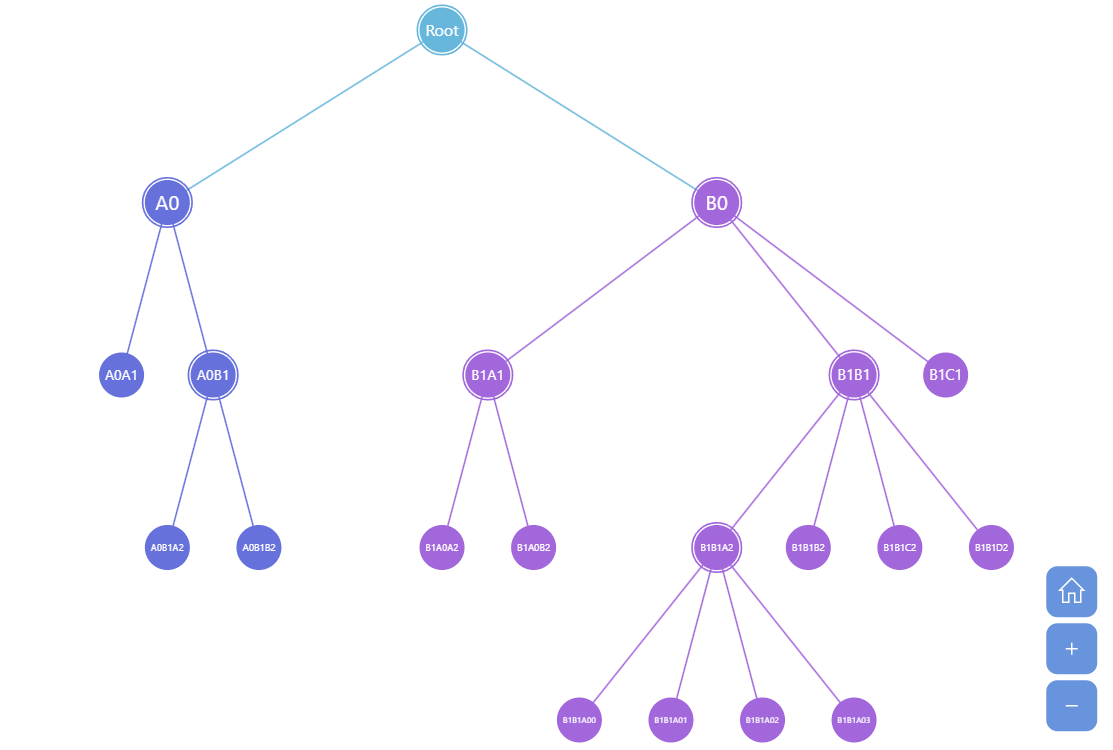
Tree Chart is the simplest form of a hierarchy chart, conceptually speaking. It displays child nodes under the parent nodes with same-level children placed on the same level visually. amCharts Tree Chart enables collapsing of the branches (try clicking on a node with children) and auto-calculation of values based on the children values.
Key implementation details
Tree chart is a part of amCharts hierarchy module. Like with other hierarchy charts we create a Container and then push a new Tree object into it. All that’s left is to specify categoryField, valueField, and childDataField for the tree.
This chart is added to a Zoomable Container, so you can pan, zoom-in and zoom-out this chart using mouse wheel, pinch-zoom or zoom tools on the bottom-right.
Related tutorials
Build this chart with AI
The prompt below can be used to build this chart with AI. For best coding results, use the most advanced AI models, like Claude Opus 4.6 and GPT-5.3-Codex. For more info and tips, check out amCharts AI docs.
Create a tree chart that visualizes hierarchical parent-child data with nodes displayed as circles connected by links. Generate random hierarchical data with a root node, up to 3 levels deep, and up to 3 nodes per level with values from 0 to 100. Child nodes should appear beneath parent nodes, with same-level children positioned horizontally. Place the chart inside a zoomable container that supports mouse wheel zooming, pinch-zoom, and drag-to-pan. Add zoom controls in the bottom-right corner. Enable branch collapsing by clicking nodes with children. The root data item should be pre-selected. Animate the series with a smooth staggered animation. Use amCharts 5 library.
Demo source