Variable Radius Pie Chart
Individual radii for each slice
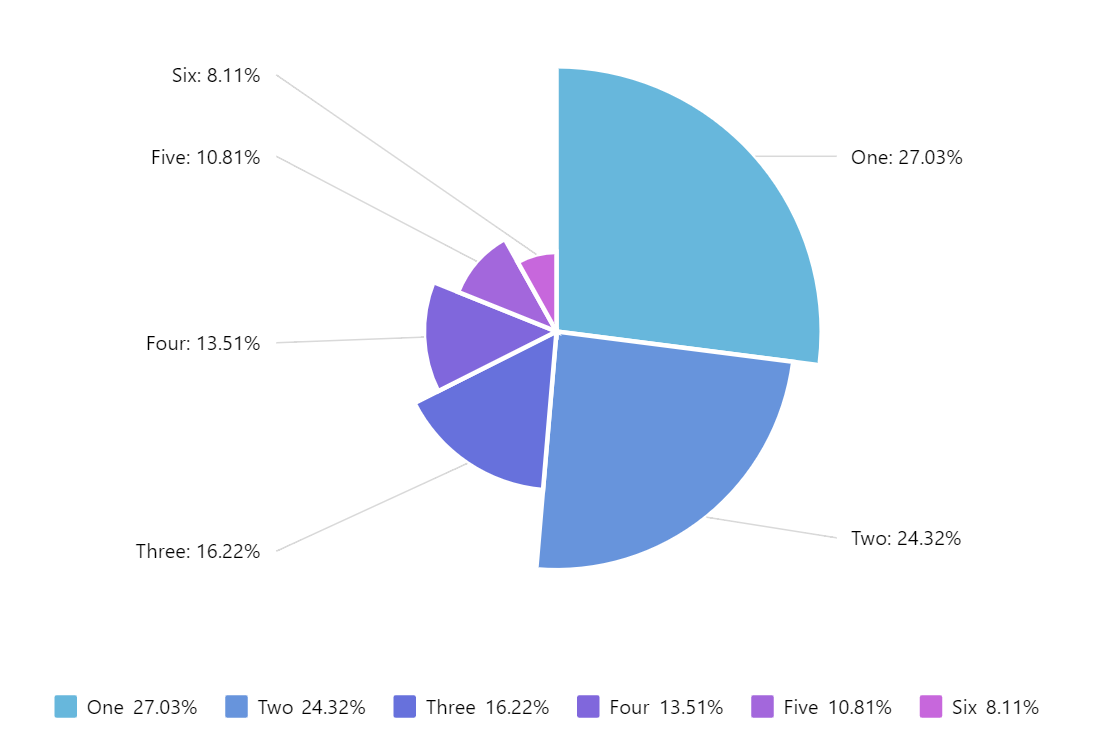
Each slice in pie series can have individual radius value, coming directly from data.
Related tutorials
Build this chart with AI
The prompt below can be used to build this chart with AI. For best coding results, use the most advanced AI models, like Claude Opus 4.6 and GPT-5.3-Codex. For more info and tips, check out amCharts AI docs.
Create a pie chart where each slice has a variable outer radius proportional to its data value, so higher-value slices extend further from the center. Use six categories ('One' through 'Six') with values 10, 6, 5, 4, 3, 3. Separate slices with thin white borders. Include a centered legend below the chart showing all categories. Labels should be positioned around the pie. Include a smooth animated sequential entrance on load. The chart should be 100% width at 500px height. Use amCharts 5 library.
Demo source