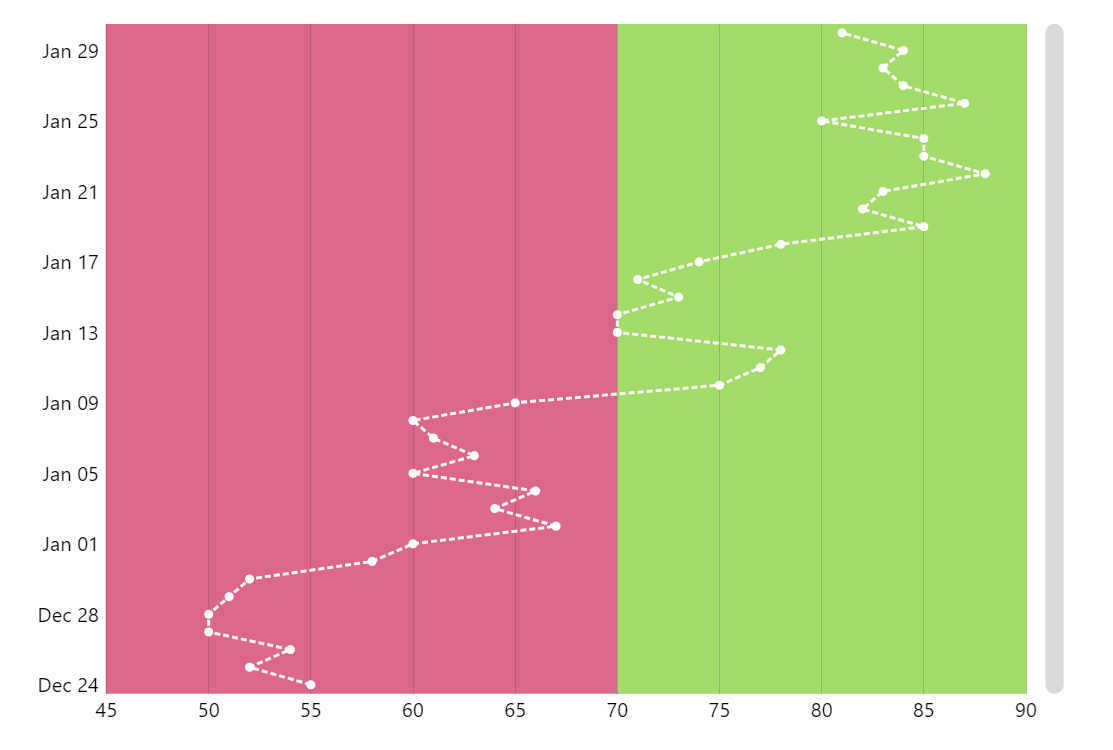
Vertical Line Chart
Need your line chart to go from the bottom to the top instead of left to right? No problem with amCharts.
Key implementation details
We just add a DateAxis as our Y axis and ValueAxis as our X axis and set the value fields on the LineSeries accordingly.
Related tutorials
Build this chart with AI
The prompt below can be used to build this chart with AI. For best coding results, use the most advanced AI models, like Claude Opus 4.6 and GPT-5.3-Codex. For more info and tips, check out amCharts AI docs.
Create a vertical line chart with dates on the Y-axis and values on the X-axis, flowing bottom-to-top. Display 38 data points (Dec 24, 2012-Jan 30, 2013) as a white dashed line with small circular markers. Add two color-coded highlighted reference zones. Include a vertical scrollbar, XY cursor with tooltips, and mouse-wheel zoom on the Y-axis. Animate on load. Use amCharts 5 library.
Demo source