Drill-down, zoomable Voronoi Treemap
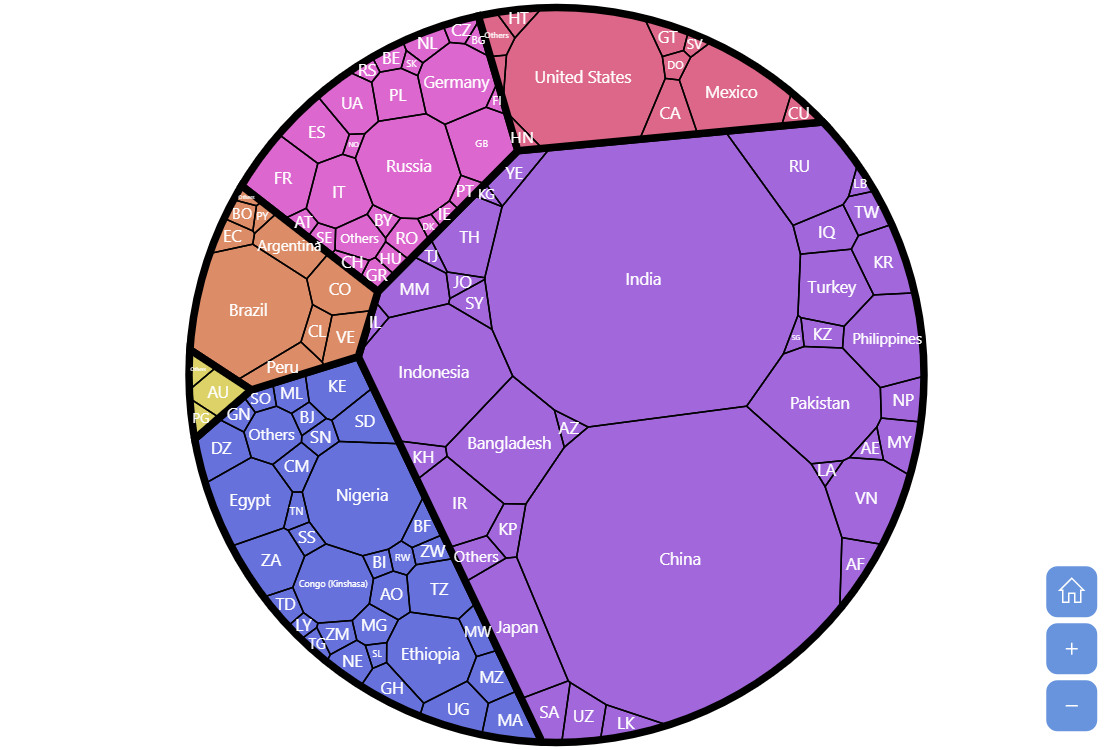
Voronoi treemaps (diagrams) are a data visualization technique that combines the concepts of Voronoi diagrams and treemaps to represent hierarchical data. In a Voronoi treemap, the available space is divided into cells based on the Voronoi diagram, where each cell represents a portion of the data. The hierarchical structure is encoded by nesting cells within each other, with larger cells containing smaller cells. The size of each cell corresponds to a quantitative value associated with the data element it represents. By employing this approach, Voronoi treemaps offer a visually appealing and space-filling representation of hierarchical data, allowing users to explore the data’s structure and proportions in a hierarchical context.
This chart is added to a Zoomable Container, so you can pan, zoom-in and zoom-out this chart using mouse wheel, pinch-zoom or zoom tools on the bottom-right.
Related tutorials
Build this chart with AI
The prompt below can be used to build this chart with AI. For best coding results, use the most advanced AI models, like Claude Opus 4.6 and GPT-5.3-Codex. For more info and tips, check out amCharts AI docs.
Create a zoomable Voronoi treemap displaying world population data in a hierarchical layout. The hierarchy should have a root, six continents, and individual countries with population values. Countries with small populations should be grouped as 'Others' per continent. Use smooth, organic cell boundaries. Style the root level as invisible, continent cells with thick black borders and solid fill, and country cells with thin borders and no fill. Show full country names for larger cells, or short country codes for smaller cells. Enable drill-down by clicking country cells to zoom to the parent continent. Wrap in a zoomable container with mouse wheel zoom, pinch-zoom, pan, and zoom controls in the bottom-right. Add padding on all sides. Animate with a smooth staggered animation. The chart should be tall. Use amCharts 5 library.
Demo source