Zoomable Radar
This demo shows all the ways to enable zooming in a radar chart.
Key implementation details
First of all, we enable zooming with a mouse wheel right when we create the chart by setting wheelY: "zoomX". This way rotating mouse wheel zooms across the chart’s X axis (the circular one). Then we add a cursor and set its behavior to zoomX as well. Finally, we add both scrollbarX and scrollbarY – controlling zooming is their default behavior, so there’s nothing extra you need to do.
Related tutorials
Build this chart with AI
The prompt below can be used to build this chart with AI. For best coding results, use the most advanced AI models, like Claude Opus 4.6 and GPT-5.3-Codex. For more info and tips, check out amCharts AI docs.
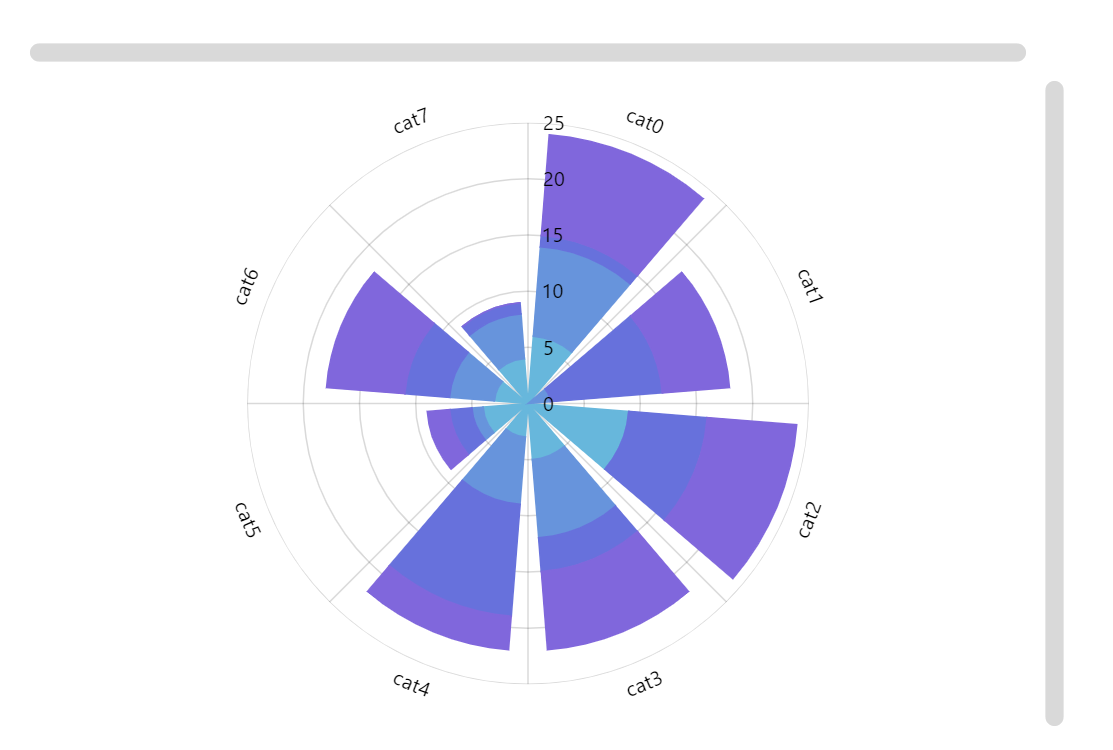
Create a zoomable radar chart with 4 stacked column series, each containing 8 randomly generated data points sharing a categorical axis. Configure multiple zoom mechanisms: mouse wheel zoom on the circular dimension, a cursor with drag-to-zoom, and both horizontal and vertical scrollbars for manual pan and zoom. Display category labels on the circular axis and a radial axis for numeric values. Show tooltips with series name and value. Animate the initial appearance with a stagger between series. Apply an animated theme. Use amCharts 5 library.
Demo source