Radial Histogram
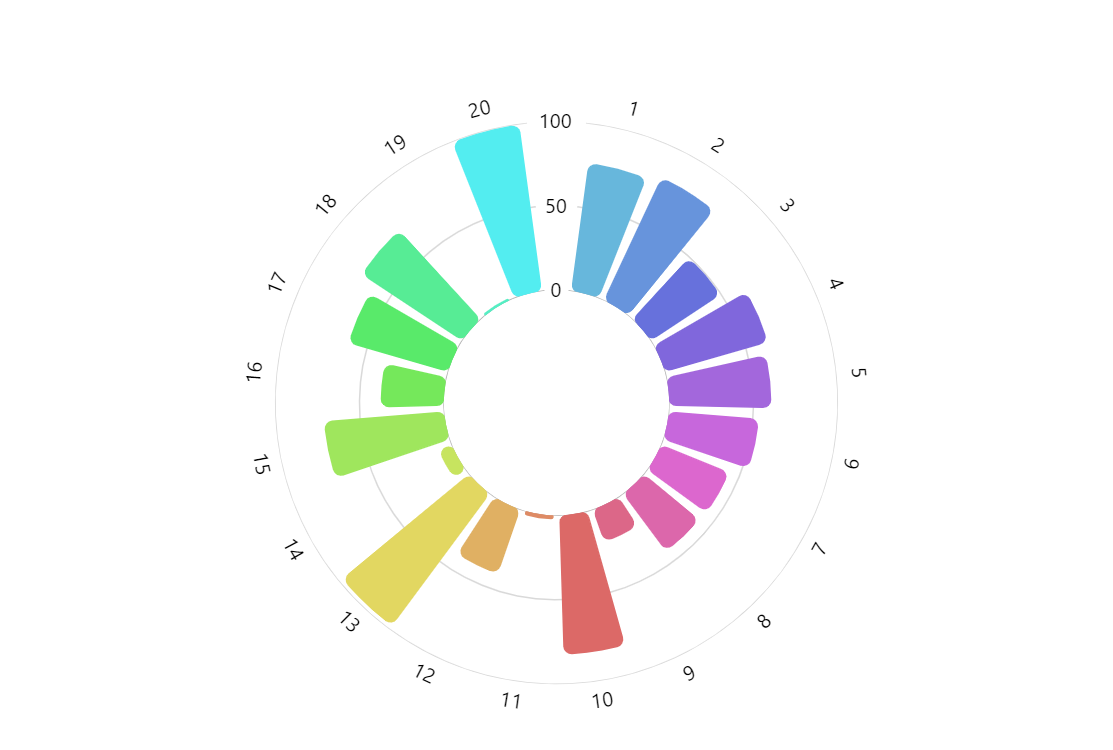
Radial Histogram (also known as Circular Histogram, Circular Bar Chart, Angular Histogram, Polar Histogram) is a variation of a bar chart where every bar is displayed along a circle. Compared to traditional linear bar charts this results in more eye-catchy visualizations with an ability to display more bars in the same space. On the negative side, these charts are harder to read and make it difficult to compare values at distant locations along the axis.
Related tutorials
Build this chart with AI
The prompt below can be used to build this chart with AI. For best coding results, use the most advanced AI models, like Claude Opus 4.6 and GPT-5.3-Codex. For more info and tips, check out amCharts AI docs.
Create a radial histogram (circular bar chart) as a three-quarter circle with a donut hole in the center. Generate 20 data points with numbered categories (1-20) and random values between 0-100. Display each bar as a column radiating outward from the center, with each column assigned a unique color from the chart palette and rounded corners. Configure a circular category axis with hidden grid lines and a radial value axis with centered labels. Add a cursor with zoom behavior and a horizontal scrollbar for category navigation. Show tooltips formatted as '{category}: {value}'. Animate series appearance on load. Use amCharts 5 library.
Demo source