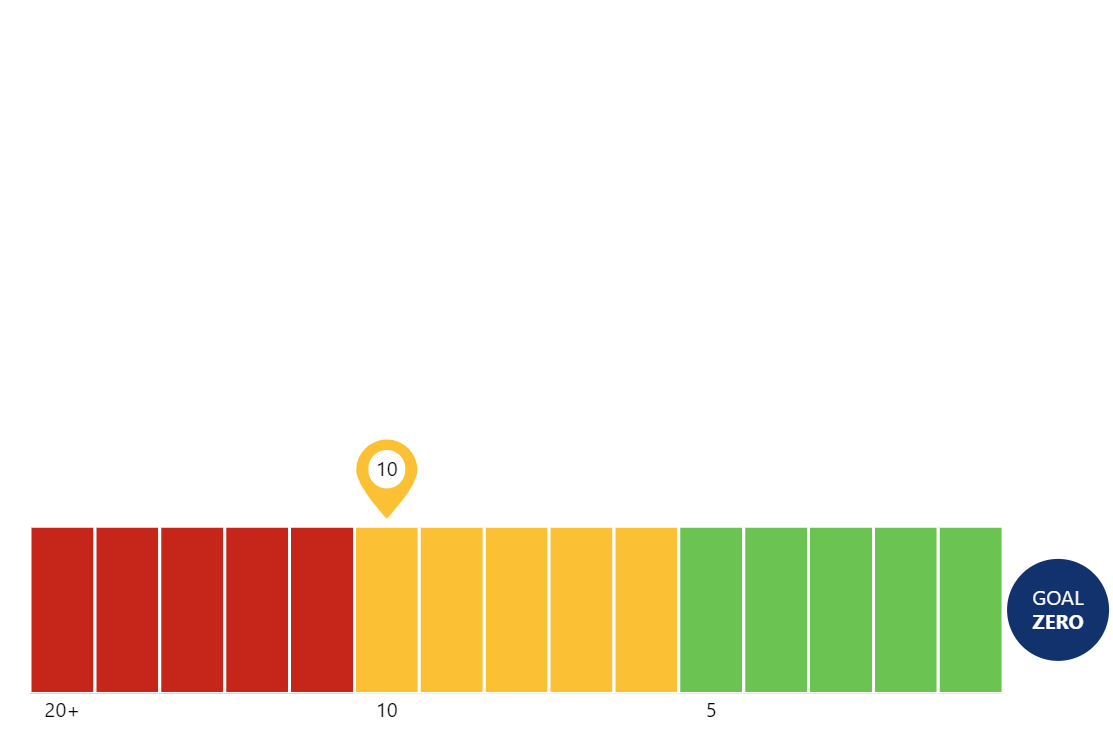
Carbon-zero Progress
amCharts flexibility allows you to go way beyond canonical chart types and use our libraries to build vast variety of data visualizations. In this demo we use the XY chart to implement a beautiful progress bar.
Key implementation details
This visualization is essentially a column chart with equal values for all columns. The data includes a columnSettings object containing the fill color that is applied by setting templateField to columnSettings. Additionally, we have currentBullet and targetBullet data fields on the corresponding items. These values are used to selectively apply the pin and the goal circle bullets on the corresponding columns.
Related tutorials
Demo source