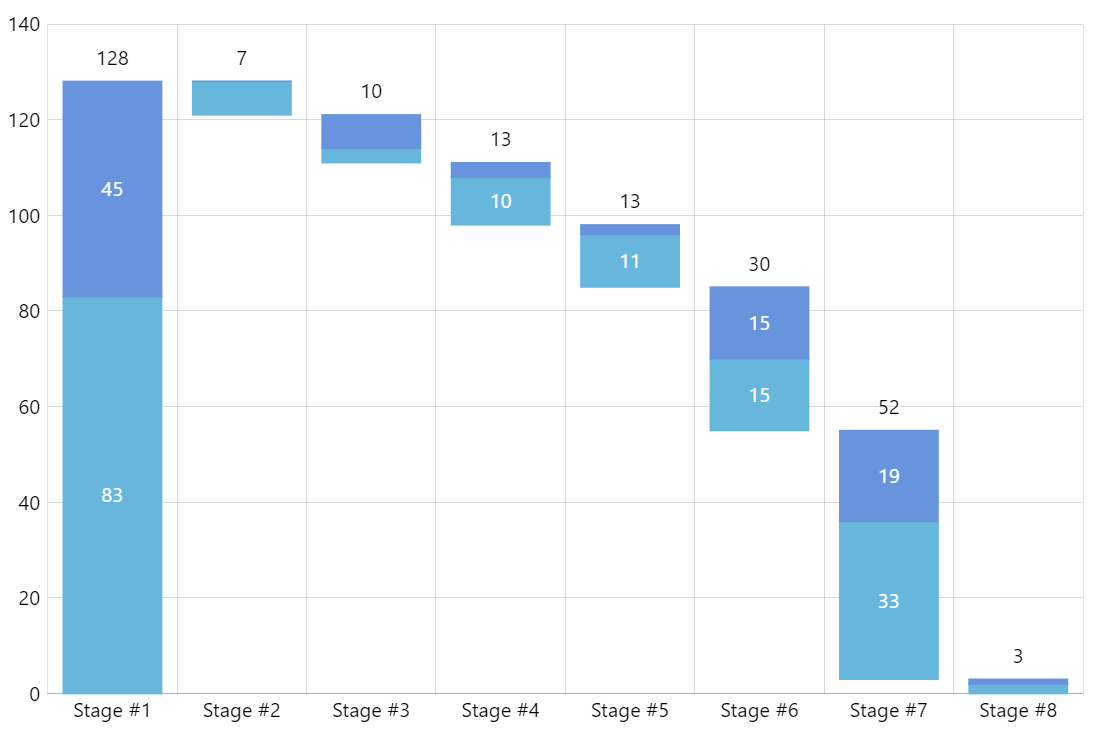
Stacked Waterfall Chart
A Waterfall Chart (also known as Flying Bricks Chart or Mario Chart or Bridge Chart) helps viewers understand the cumulative effect of sequential events. Stacking series of events gives a clearer picture of the effect of multiple parallel series.
Key implementation details
The key to implementing waterfall charts with amCharts is using the openValueYField of ColumnSeries to “suspend” the columns in the air. To get the series appear as stacked (don’t confuse with actually stacked values) we just set its clustered property to false.
Related tutorials
Demo source