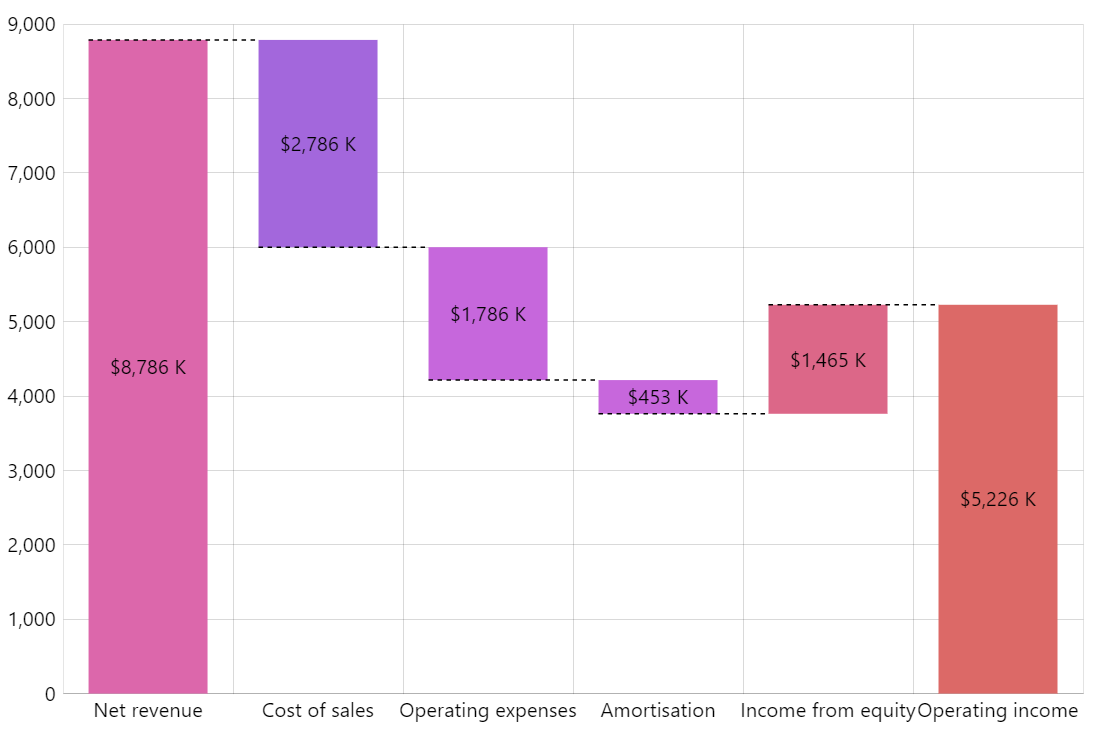
Waterfall Chart
Waterfall Chart (also known as Flying bricks chart, Mario chart, Cascade chart) is most frequently used to display the effect of the series of consecutive positive or negative events on the initial value.
Mixed series types
amCharts 5 allows mixing a number of different series on the same chart. This particular Waterfall chart is enabled by combining a floating Column series and a no-riser Step series.
Flexible line start and end location setting enables fine-tuning connector line position for perfect fit.
Related tutorials
Demo source