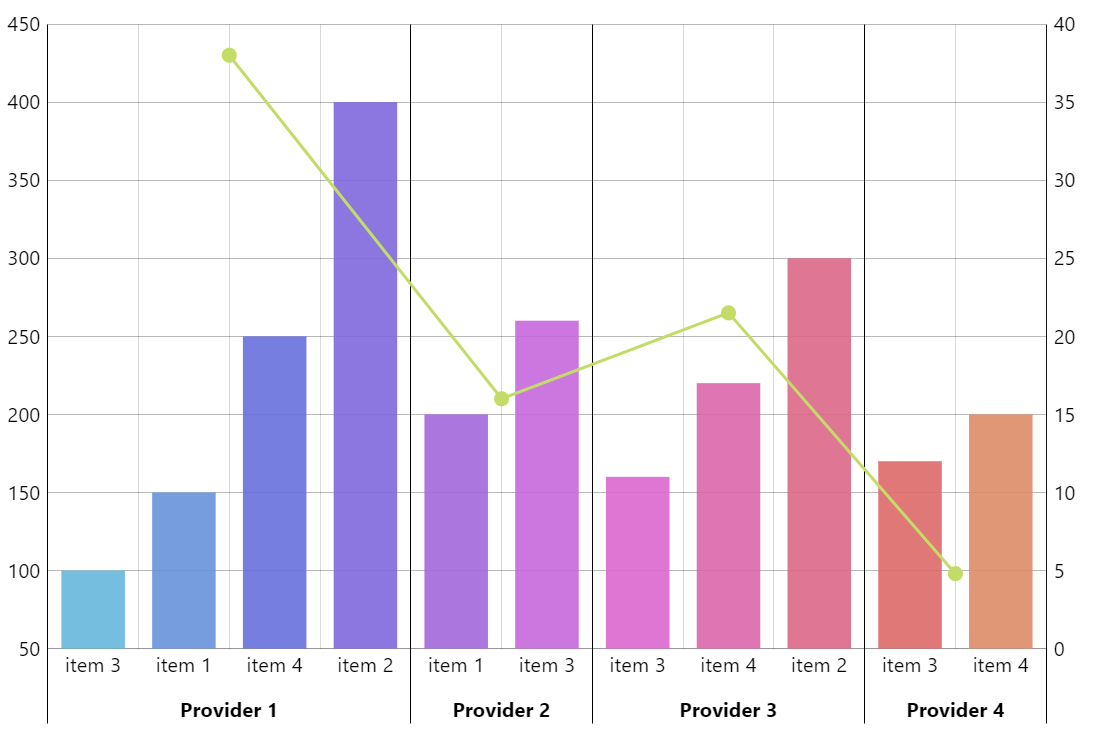
Grouped and Sorted Columns
amCharts libraries are flexible in a way that even when something is not a special feature in the library, you can still easily implement it with amCharts. In this case we have a 2-level deep dataset but we want to represent it as a column chart you see here – no problem with amCharts 5!
Key implementation details
To achieve the result we “flatten” the data set into a flat array, sort it and use the axis ranges feature to create these visual groups.
Related tutorials
Demo source