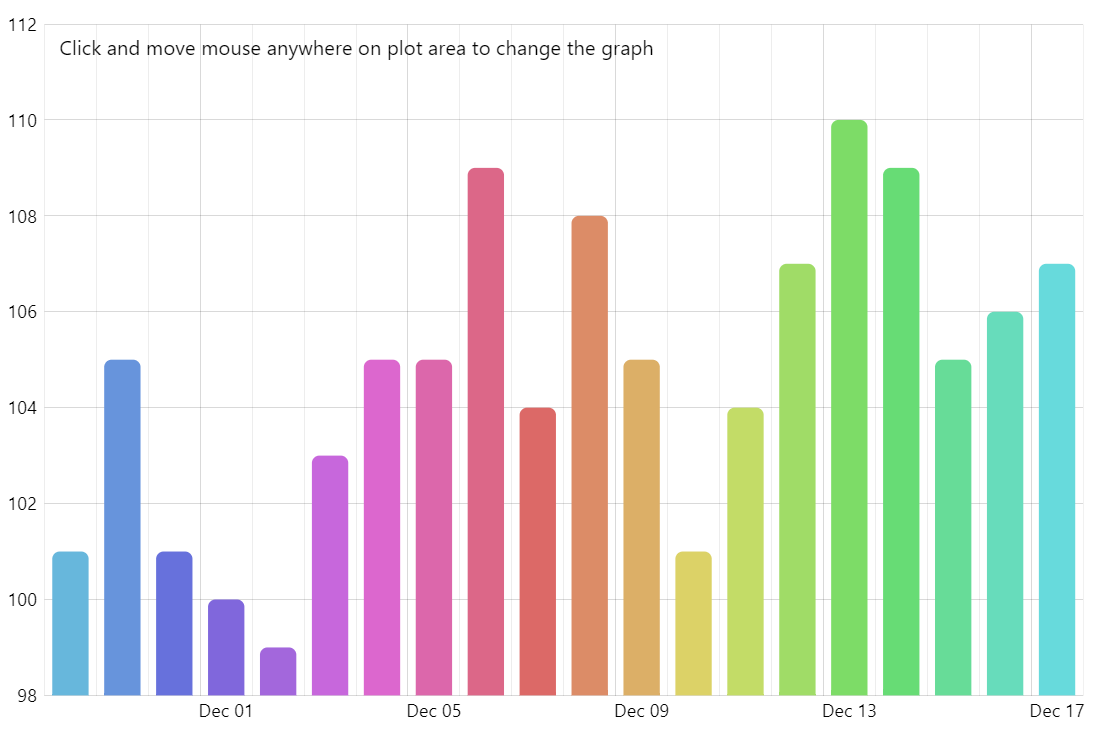
Drag and change column value
While amCharts libraries primarily focus on data visualization, they can also be used as UI where it makes sense, thanks to all the great interactivity features. In this demo you can adjust the values behind the columns simply by dragging the columns up and down.
Key implementation details
To achieve this behavior we setup pointer event handlers on the chart’s plotContainer (namely, pointerdown, globalpointerup, and globalpointermove) and in the pointer move event handler we adjust the underlying data item value. We use Y-axis methods coordinateToPosition() and positionToValue() to convert the pointer coordinates into the underlying values of the series.
Related tutorials
Demo source