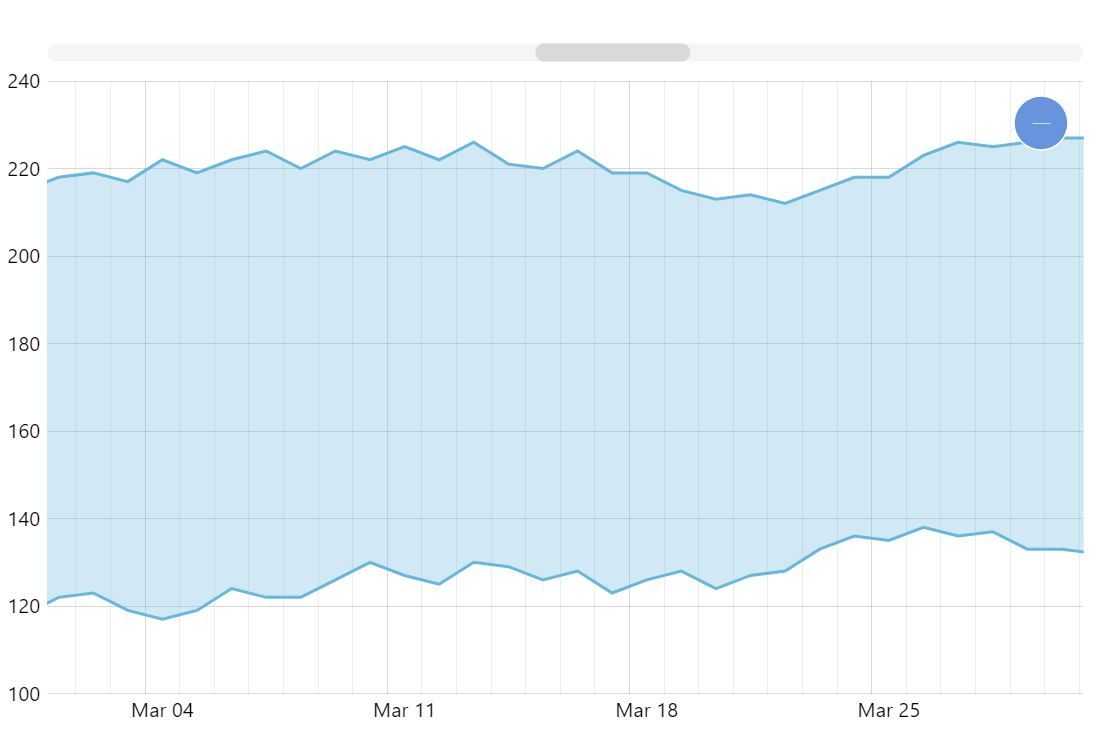
Range Area Chart
Range Area Chart is a type of area chart where rather than starting on the axis, the area is represented by the space between two values. These charts are useful for displaying ranges of values, such as between minimum and maximum prices over a timespan, or projected values for the future when the projection is represented by a range instead of a specific value.
Related tutorials
Build this chart with AI
The prompt below can be used to build this chart with AI. For best coding results, use the most advanced AI models, like Claude Opus 4.6 and GPT-5.3-Codex. For more info and tips, check out amCharts AI docs.
Create a range area chart with 200 daily data points showing a shaded band between upper and lower bound lines rather than filling from the axis baseline. Use two lines in the same color with a semi-transparent fill between them. Include pan/zoom on both axes, horizontal scrollbar, XY cursor with horizontal tooltips, and entrance animation. Use amCharts 5 library.
Demo source