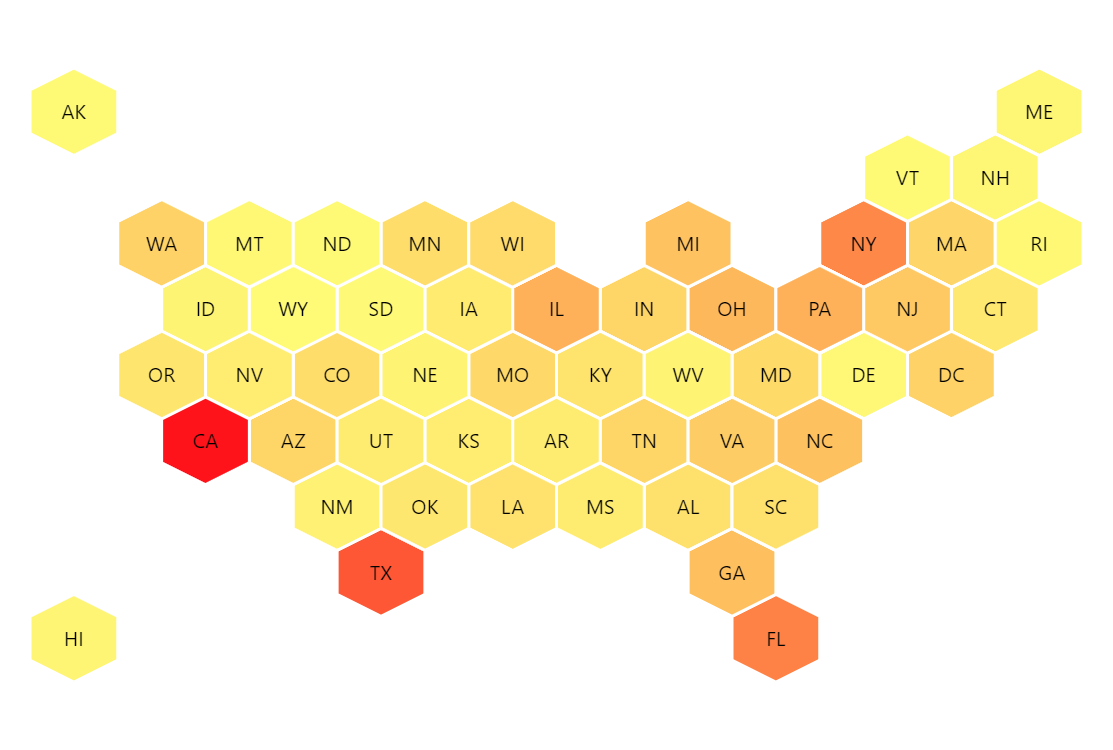
Honeycomb tile map
This Honeycomb or hex map is a simple XYChart with bullets arranged so that they resemble true map.
Related tutorials
Build this chart with AI
The prompt below can be used to build this chart with AI. For best coding results, use the most advanced AI models, like Claude Opus 4.6 and GPT-5.3-Codex. For more info and tips, check out amCharts AI docs.
Create a honeycomb tile map of US states using hexagonal icons arranged in a grid to resemble a geographic map. Position each state at specific grid coordinates with odd rows slightly offset for proper hexagonal tessellation. Hide axes and grid lines. Draw white-bordered hexagons colored based on population using a gradient from yellow to red. Display two-letter state abbreviations centered in each hexagon. Show tooltips with the full state name and population on hover. Animate states into view on load. Use amCharts 5 library.
Demo source