Population Pyramid
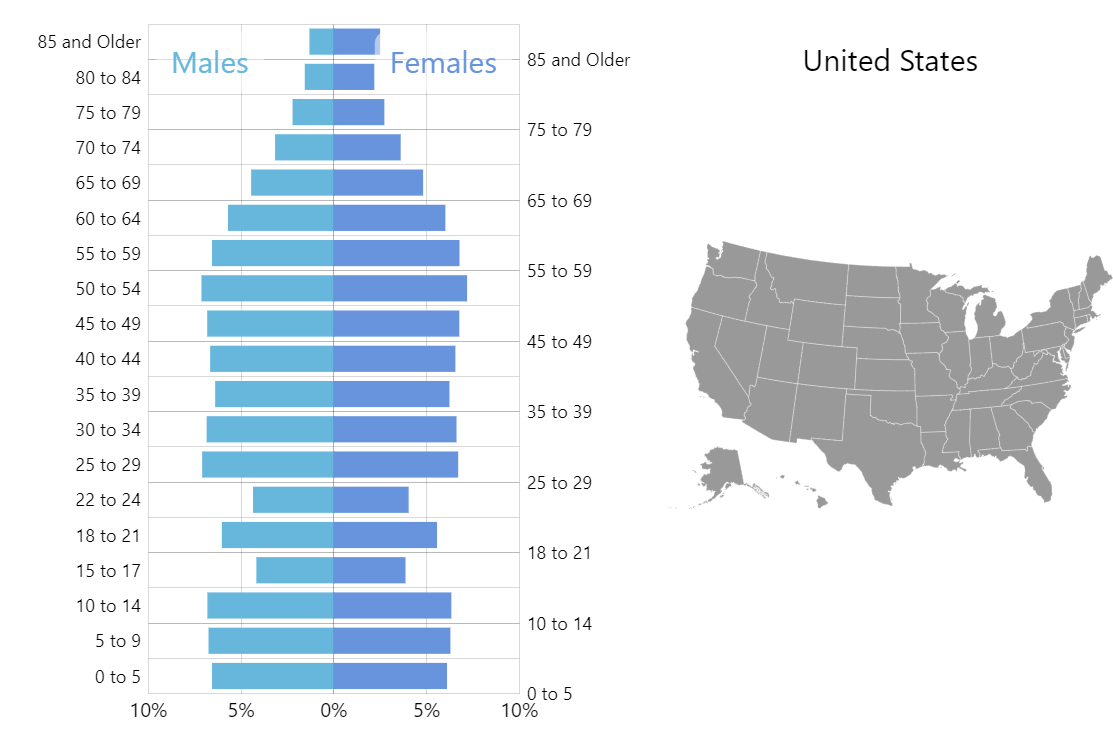
A population pyramid, also called an “age-sex-pyramid” or “mirror bar chart”, is a graphical illustration that shows the distribution of various age groups in a population.
Combined and linked with a map chart we get a great interactive visual that lets viewers easily analyze the data across regions.
Related tutorials
Build this chart with AI
The prompt below can be used to build this chart with AI. For best coding results, use the most advanced AI models, like Claude Opus 4.6 and GPT-5.3-Codex. For more info and tips, check out amCharts AI docs.
Create a population pyramid chart linked to an interactive US map. The pyramid is a horizontal bar chart with a shared category axis listing age groups (0-5 through 85+). Male bars extend leftward and female bars extend rightward from the center, showing percentages. Use distinct colors for male and female series. Include a US choropleth map beside the chart; clicking a state on the map should update the pyramid to show that state's age and gender distribution. Highlight the active state on the map. Show tooltips with population counts and percentages on bar hover. Animate the bars on load and when data changes. Use amCharts 5 library.
Demo source