Range Bullet Chart
Bullet charts can be useful by effectively displaying some value against the target goal, for example.
Key implementation details
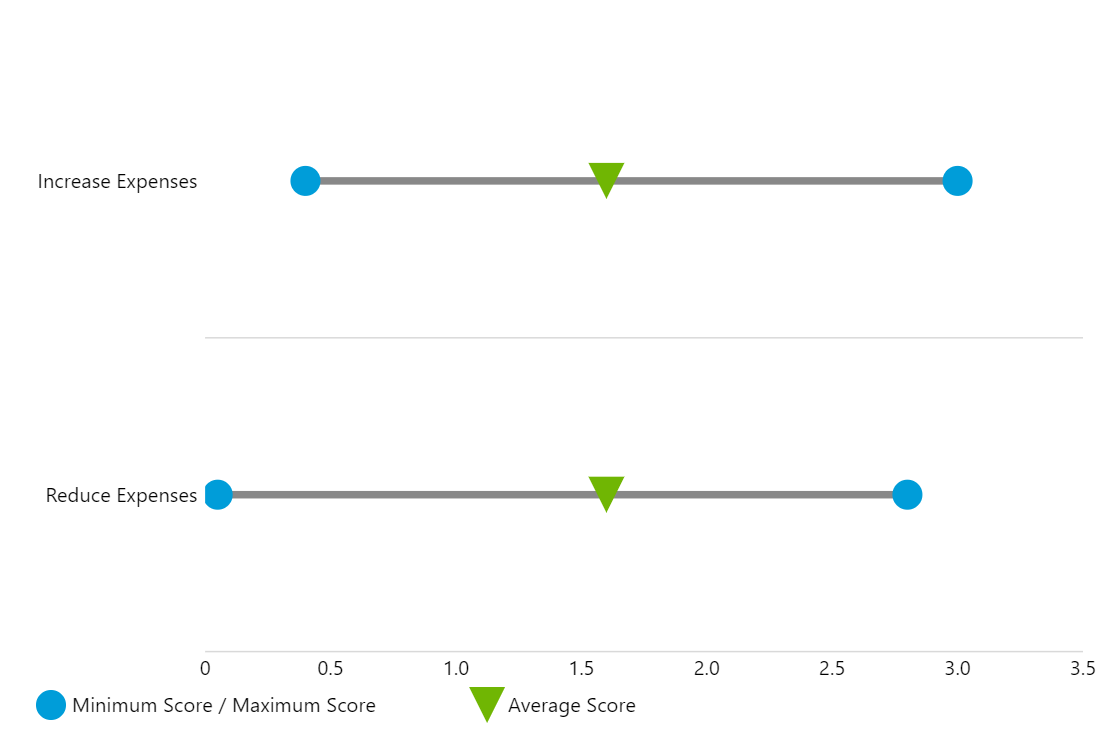
To create the “range line” in this demo we use a narrow ColumnSeries (horizontal bars) with its openValueXField (start position) and valueXField (end position) set to open/close values from our dataset. We add circle bullets in both of those locations by creating two bullets: one in locationX: 0 (start) and the other in locationX: 1 (end). Finally, we create a LineSeries for our triangle bullet (valueXField set to average from the dataset), set its stroke to invisible, and add a Triangle bullet to it.
Related tutorials
Build this chart with AI
The prompt below can be used to build this chart with AI. For best coding results, use the most advanced AI models, like Claude Opus 4.6 and GPT-5.3-Codex. For more info and tips, check out amCharts AI docs.
Create a horizontal bullet chart with two categories (Reduce Expenses and Increase Expenses). For each category, display a gray horizontal bar representing the score range. Overlay blue circle markers at the minimum and maximum endpoints. Add green upward-pointing triangle markers indicating the average score. Use a vertical category axis. Remove grid lines from the horizontal value axis. Include a legend showing Minimum Score / Maximum Score and Average Score. Disable panning and scroll interactions. Use amCharts 5 library.
Demo source