Stock Chart Candlesticks
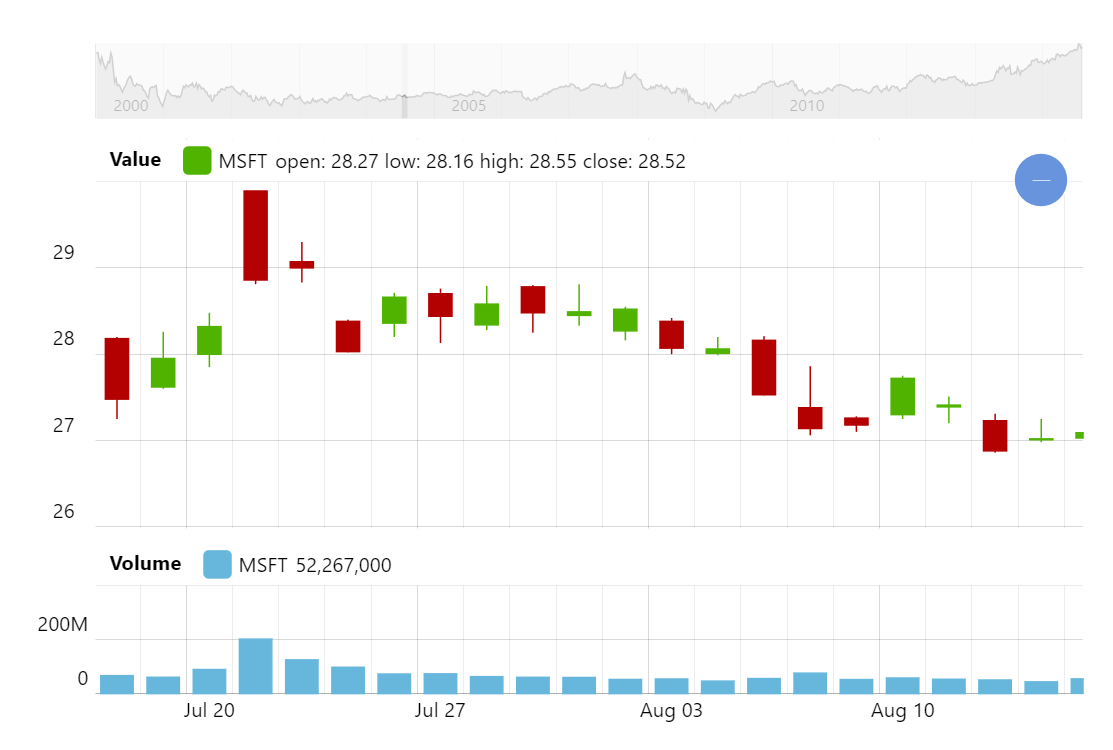
You can create your typical stock charts with amCharts XYChart. In this example we create a candlestick stock price graph and a volume graph under it.
Key implementation details
We add 2 value axes to our chart: one for the price part (valueAxis) and one for the volume part (volumeAxis). We set height on the valueAxis to be 70% and 30% on the volumeAxis. Then we add CandlestickSeries for the price graph and ColumnSeries for the volume graph. We assign valueAxis property on each graph accordingly, and both use the same date axis as their X-axis.
Related tutorials
Build this chart with AI
The prompt below can be used to build this chart with AI. For best coding results, use the most advanced AI models, like Claude Opus 4.6 and GPT-5.3-Codex. For more info and tips, check out amCharts AI docs.
Create a dual-panel stock chart for Microsoft (MSFT) data loaded from an external CSV file. The upper panel (taking up about 70% of the height) shows a candlestick series with daily OHLC prices; the lower panel (about 30%) shows a column series for trading volume with large numbers abbreviated (e.g., '1M'). Load CSV data with fields: Date, Open, High, Low, Close, Adjusted Close, Volume, in reverse chronological order. Add an XY cursor tracking values across both panels simultaneously. Include a horizontal scrollbar showing weekly-aggregated data as a miniature line chart preview. Position legends in axis headers displaying series names with current values. Tooltips show ticker name, value, and percentage change. Enable X-axis pan and mouse wheel zoom. Animate over 1 second. Use amCharts 5 library.
Demo source