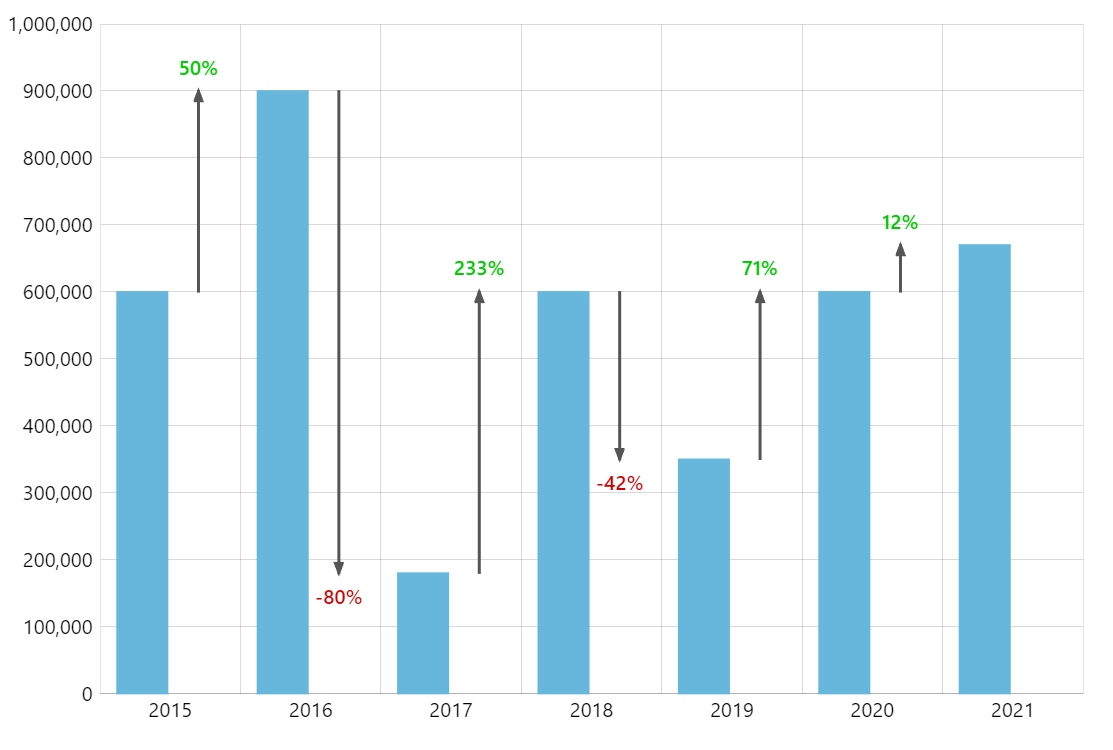
Variance Indicators
A clever use of highly configurable clustered Column series and adapters enables us to create automatically-calculated variance indicators.
Key implementation details
While from the viewer’s perspective we see one column series and arrows next to it, from the developer’s perspective these are two column series. One is your regular column series, and the other cleverly uses openValueYField with the current value to make “columns” start off-axis, and valueYField with calculated (next column’s value) values.
Then we create custom graphics arrow bullets and rotate them in the bullet’s adapter based on the calculated variance.
Related tutorials
Demo source