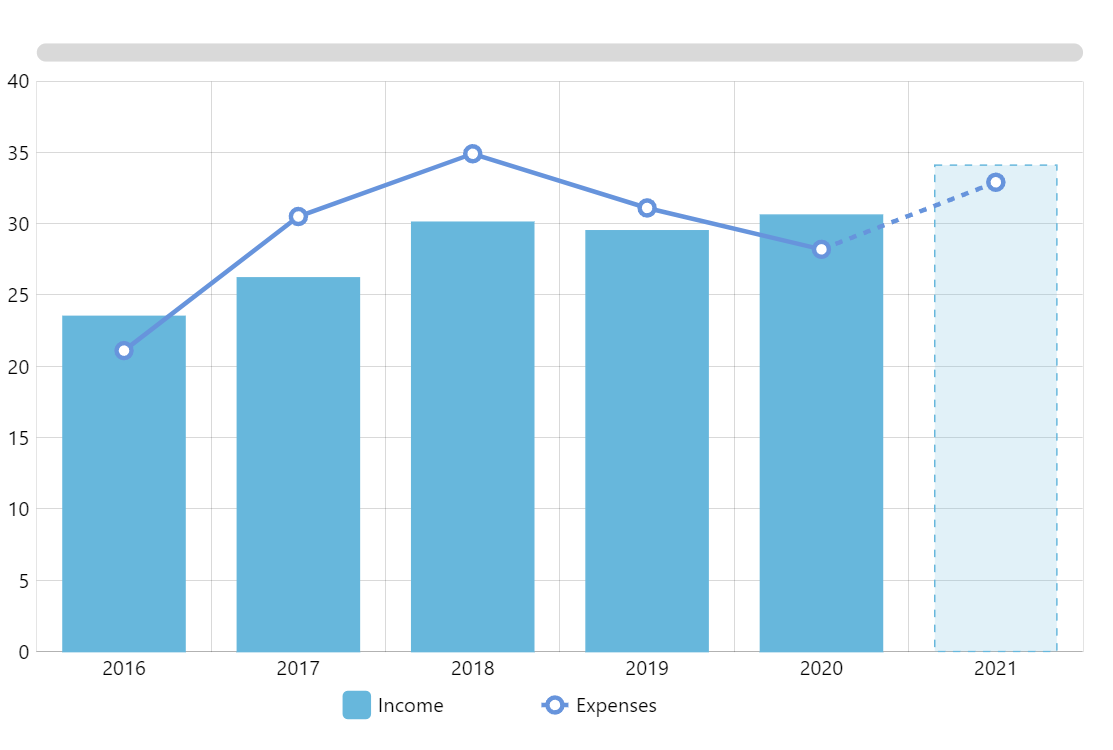
amCharts The best flash charts *
Home Home
Charts Charts
Download Download
Buy Buy
FAQ FAQ
Documentation Documentation
Support forum Support forum

Column & Bar chart

You need to upgrade your Flash Player

This is a universal 3D/2D column & bar chart. It can be clustered, stacked and 100% stacked. Columns and bars can be floating, or fused together to create histograms. This chart is also capable of displaying line & area graphs – even overlaid on top of a colum/bar chart.

Key features:
  • Animated or static
  • Value axis can be reversed
  • Linear or logarithmic value axis scale
  • Predefined or custom bullets
  • Custom description for any data point
  • Clickable columns/bars (can be used for drill-down charts)
  • Gradient fills
  • Value indicator plug-in
  • Axis values inside the plot area
Common amCharts features:
  • Platform-independent
  • Can be exported as an image
  • Can be controlled via JavaScript
  • Settings and data can be passed directly from an HTML file
  • Custom image or Flash (animated) backgrounds
  • Unlimited labels
  • Rotated labels and axis values
  • Data can be automatically reloaded with a preset frequency
  • Format any balloon text
AmCharts can extract data from simple CSV or XML files, or they can read dynamic data generated with PHP, .NET, Java, Ruby on Rails, Perl, ColdFusion, and many other programming languages.

Visit the documentation section to learn about all the possibilities provided by this chart or find out about main features by examples.

view settings file | view data file

Column & Bar
Column and line chart mix
3D Stacked column chart
Controlling chart with JavaScript
Chart with gradient fills
Histogram chart
Floating chart
Images above the columns
Auto-resizing chart

Line & Area
Chart with scroller
Chart with data gaps
Two Y-axes chart
Logarithmic scale chart
Auto-reloading chart
Chart with reversed Y axis

Pie & Donut
2D pie chart
3D donut chart
Saving chart as image
Advanced navigation menus

Scatter & Bubble
Time plot
Chart with value indicator

Stock chart
Data at irregular intervals
OHLC chart
Multiple data sets

ASP.NET Controls
© Antanas Marcelionis Contact and feedback: info@amcharts.com Subscribe to amcharts news feed by e-mail or RSS reader * many people say so ;)