Bar and Line Chart Mix
Mixing bar and line chart in the same visual is a good way to emphasize the difference between series while still maintaining their relationship.
In amCharts 5 it’s as easy as adding different type of series to an XYChart (in this case ColumnSeries and LineSeries)
Related tutorials
Build this chart with AI
The prompt below can be used to build this chart with AI. For best coding results, use the most advanced AI models, like Claude Opus 4.6 and GPT-5.3-Codex. For more info and tips, check out amCharts AI docs.
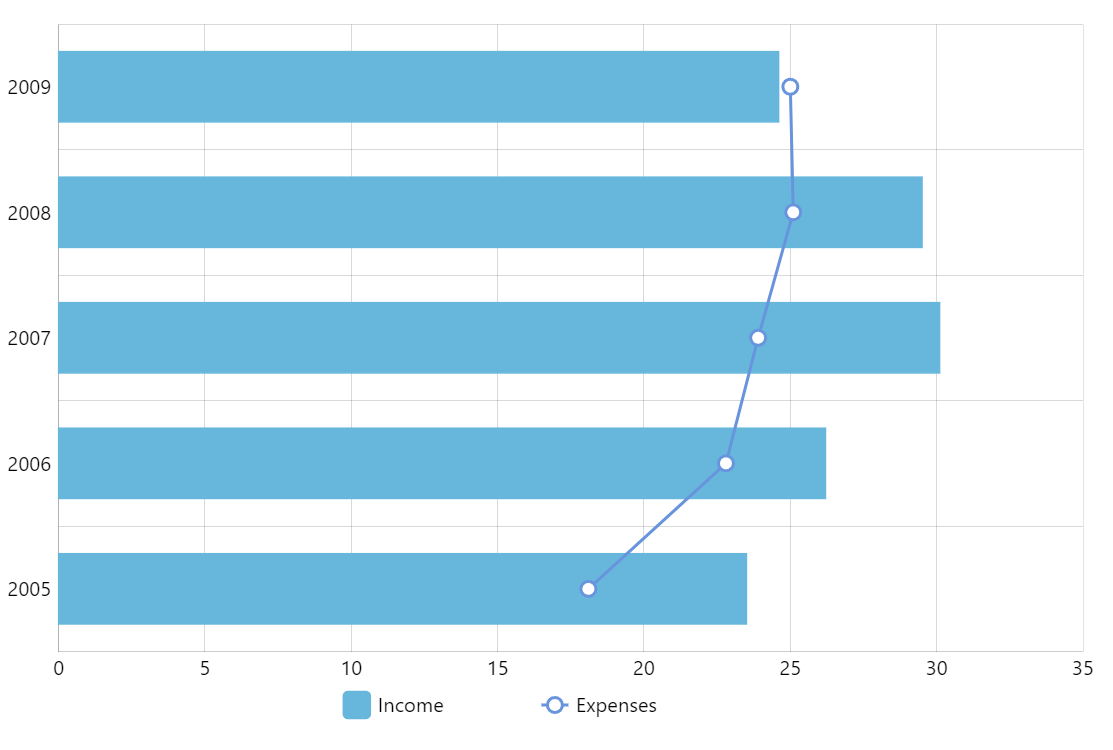
Bar-and-line combination chart showing income (horizontal bars) versus expenses (line with markers) across five years. Use amCharts 5 library.
Demo source