Show Percentage Change
If your data already has percent values, then all you need to do is to add % sign to the y axis labels, for this you set number format on the axis:
var yAxis = chart.yAxes.push(am5xy.ValueAxis.new(root, {numberFormat: "#'%'", renderer: am5xy.AxisRendererY.new(root, {}) }));
If your values are not recalculated to percent, there are two options:
1) show the change in percent when first value in the selection is used as a base value. This way first value in the selection will always be 0.
For this, two settings must be added to series:
calculateAggregates: true,valueYShow: "valueYChangePercent"
2) show the change is percent when first value of your data is used as a base value:
For this, two settings must be added to series:
calculateAggregates: true, valueYShow: "valueYChangePercent"
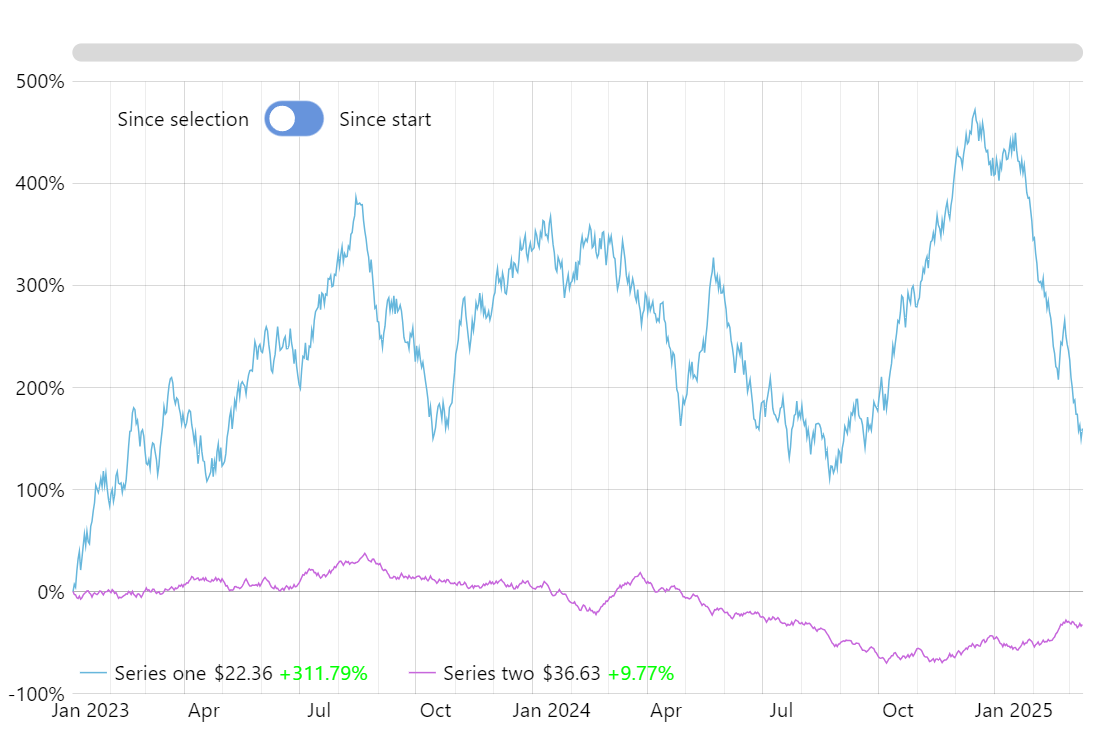
You might want to adjust what you show in a tooltip and legend value. Check the source of this demo – when a switch at the top of a chart is toggled, the chart changes from one mode to another changing tooltip and legend text as well.
Related tutorials
Build this chart with AI
The prompt below can be used to build this chart with AI. For best coding results, use the most advanced AI models, like Claude Opus 4.6 and GPT-5.3-Codex. For more info and tips, check out amCharts AI docs.
Create a multi-series line chart with two series of 800 daily data points showing values as percentages. Add a toggle button switching between two modes: percentage change relative to the first visible value, and percentage change from the very first data point. Display a legend with current percentage values, coloring positive green and negative red. Include pan/zoom, horizontal scrollbar, and formatted tooltips. Animate on load. Use amCharts 5 library.
Demo source