Mars Landing Sites
Mars as a slowly turning globe, covered with the Viking orbiters' color map of its surface, and the ten landers and rovers that worked there, from Viking 1 in 1976 to Perseverance and Zhurong in 2021. In teal, two places that are fiction: the Ares 3 and Ares 4 sites from the novel The Martian.
Maps of other worlds
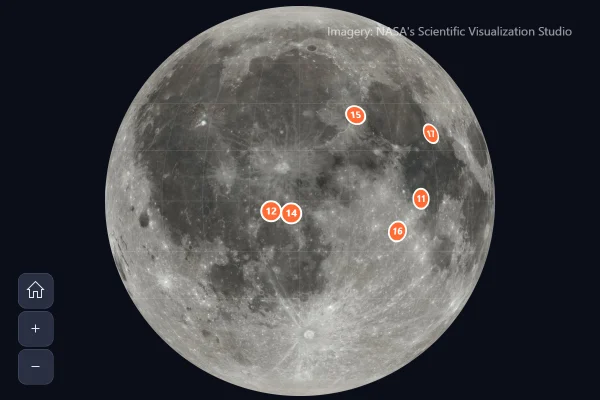
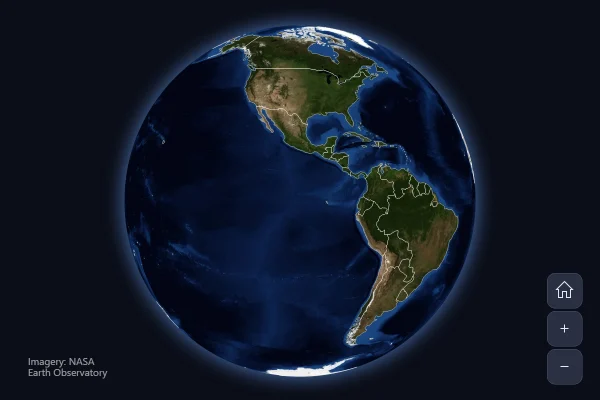
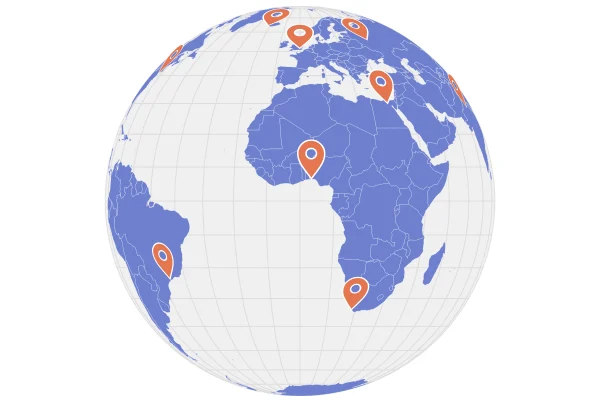
A map chart doesn't have to show the Earth. Give a raster series any whole-planet picture in the usual equirectangular layout, and the globe wears it, turning and zooming like any map; markers, lines and a grid go on top by latitude and longitude, as on the Earth. The amCharts CDN has such pictures of the Moon, Mars, Venus, Jupiter, Io and Ganymede.
Good for
- Space missions, landings and probes
- Science and education pages
- An eye-catching opener for a story
Think twice when
- Comparing places on the far side: one side shows at a time
- Exact positions: a flat map is easier to read
Get the code.
Built with amCharts 5, a JavaScript library. The JavaScript includes your theme and renderer (canvas or SVG); the JSON also follows the changes you make with the controls.
npm install @amcharts/amcharts5. See Getting started.
The same chart as a JSON config. Chart Maker reads and writes this format, the library's JSON parser turns it into a chart, and the <am5-chart> element puts it on a page with no code.How it reads:
"type" is the class to create and "settings" what you would pass to its new() in code; "properties" fill in its parts, lists such as series and axes or templates such as columns.template; "refs" holds objects used in more than one place ("#series-0" stands for the one named series-0); a string starting with "@" takes a value from another object, such as "@series.get('fill')".
A complete page. Save it as an .html file and open it in a browser.
Paste this into an AI coding assistant to build the chart from scratch. More in amCharts & AI.
// Create root element
// https://www.amcharts.com/docs/v5/getting-started/#Root_element
var root = am5.Root.new("chartdiv");

// Set themes
// https://www.amcharts.com/docs/v5/concepts/themes/
root.setThemes([
  am5themes_Animated.new(root),
  am5themes_Responsive.new(root)
]);

// The buttons (the zoom control) in a dark slate that suits the night sky, instead of the default blue
root.interfaceColors.setAll({
  primaryButton: am5.color(0x2a3042),
  primaryButtonHover: am5.color(0x3a4259),
  primaryButtonDown: am5.color(0x485170),
  primaryButtonActive: am5.color(0x485170),
  primaryButtonStroke: am5.color(0x4a5370),
  primaryButtonText: am5.color(0xe6e8f0),
  primaryButtonDisabled: am5.color(0x1c2030),     // the minus button, zoomed out as far as it goes
  primaryButtonTextDisabled: am5.color(0x5c6278)
});

// Create the map chart: Mars as a globe that turns once every two minutes
// https://www.amcharts.com/docs/v5/charts/map-chart/
var chart = root.container.children.push(am5map.MapChart.new(root, {
  projection: am5map.geoOrthographic(), // a globe, seen from space
  panX: "rotateX",                      // a sideways drag spins the planet
  panY: "rotateY",                      // an up or down drag tilts it
  minZoomLevel: 0.5,                    // zooming out stops at half size
  rotationY: -15                        // a little from above, so the northern sites show
}));

// Turn Mars: a full turn every 2 minutes at a steady speed, for ever. The animation is kept, so pointing at a site
// can pause it (below)
// https://www.amcharts.com/docs/v5/concepts/animations/
var spin = chart.animate({ key: "rotationX", from: 0, to: 360, duration: 120000, loops: Infinity });

// A site's marker pointed at: it grows a little, and Mars stops turning so the site stays under the pointer
// https://www.amcharts.com/docs/v5/concepts/settings/states/
function hoverable(circle) {
  circle.states.create("hover", { scale: 1.4 });
  circle.events.on("pointerover", function() { spin.pause(); });
  circle.events.on("pointerout", function() { spin.play(); });
  return circle;
}

// Add the picture of Mars, a map of the whole planet redrawn to fit the globe as it turns: the Viking orbiters'
// colorized mosaic, read from the amCharts CDN
// https://www.amcharts.com/docs/v5/charts/map-chart/map-raster-series/
var rasterSeries = chart.series.push(am5map.MapRasterSeries.new(root, {
  src: "https://cdn.amcharts.com/lib/5/geodata/images/mars2048.jpg"
}));

// Add a faint grid of latitudes and longitudes, every 15 degrees
// https://www.amcharts.com/docs/v5/charts/map-chart/graticule-series/
var graticuleSeries = chart.series.push(am5map.GraticuleSeries.new(root, {
  step: 15
}));

graticuleSeries.mapLines.template.setAll({
  stroke: am5.color(0xffffff), // white over the red surface...
  strokeOpacity: 0.1           // ...faint
});

// Every mission that landed on Mars and worked there, where it came down (degrees, east longitude), and when
var sites = [
  { name: "Viking 1", type: "Lander", place: "Chryse Planitia", date: "July 20, 1976", latitude: 22.27, longitude: -47.95 },
  { name: "Viking 2", type: "Lander", place: "Utopia Planitia", date: "September 3, 1976", latitude: 47.64, longitude: 134.29 },
  { name: "Pathfinder", type: "Lander and rover", place: "Ares Vallis", date: "July 4, 1997", latitude: 19.13, longitude: -33.22 },
  { name: "Spirit", type: "Rover", place: "Gusev crater", date: "January 4, 2004", latitude: -14.57, longitude: 175.47 },
  { name: "Opportunity", type: "Rover", place: "Meridiani Planum", date: "January 25, 2004", latitude: -1.95, longitude: -5.53 },
  { name: "Phoenix", type: "Lander", place: "Vastitas Borealis", date: "May 25, 2008", latitude: 68.22, longitude: -125.75 },
  { name: "Curiosity", type: "Rover", place: "Gale crater", date: "August 6, 2012", latitude: -4.59, longitude: 137.44 },
  { name: "InSight", type: "Lander", place: "Elysium Planitia", date: "November 26, 2018", latitude: 4.5, longitude: 135.62 },
  { name: "Perseverance", type: "Rover", place: "Jezero crater", date: "February 18, 2021", latitude: 18.44, longitude: 77.45 },
  { name: "Zhurong", type: "Rover", place: "Utopia Planitia", date: "May 15, 2021", latitude: 25.07, longitude: 109.93 }
];

// Create point series for the sites: markers that face the viewer and hide once they turn to the far side
// https://www.amcharts.com/docs/v5/charts/map-chart/map-point-series/
var siteSeries = chart.series.push(am5map.MapPointSeries.new(root, {
  latitudeField: "latitude",
  longitudeField: "longitude"
}));

// Each site: an orange circle with a white ring, and the mission, what it was, the place and the date on hover
siteSeries.bullets.push(function() {
  return am5.Bullet.new(root, {
    sprite: hoverable(am5.Circle.new(root, {
      radius: 6,
      fill: am5.color(0xff6b35),   // orange, clear against the red-brown surface
      stroke: am5.color(0xffffff), // with a white ring
      strokeWidth: 2,
      tooltipText: "[bold]{name}[/] ({type})\n{place}\nLanded {date}",
      tooltipY: 0,                 // the tooltip points at the top of the circle, not its middle
      cursorOverStyle: "pointer"   // a hand over the marker: there is more to see
    }))
  });
});

siteSeries.data.setAll(sites);

// Create a second point series for the names: labels beside the markers, hidden on the far side with them
var labelSeries = chart.series.push(am5map.MapPointSeries.new(root, {
  latitudeField: "latitude",
  longitudeField: "longitude"
}));

labelSeries.bullets.push(function() {
  return am5.Bullet.new(root, {
    sprite: am5.Label.new(root, {
      text: "{name}",
      populateText: true,        // fills in the name from the site's data
      fill: am5.color(0xffffff),
      fontSize: "0.8em",
      fontWeight: "600",
      centerX: am5.p50,          // centered...
      centerY: 0,                // ...under the marker,
      dy: 8,                     // just clear of its circle...
      paddingTop: 0,             // ...with none of a label's usual space above the text
      interactive: false         // the marker has the tooltip
    })
  });
});

labelSeries.data.setAll(sites);

// Create point series for two places that are fiction: the Ares 3 and Ares 4 sites from Andy Weir's novel The Martian
// (2011, a film in 2015), where NASA's HiRISE camera photographed the real ground. Teal, not orange, with
// "(fictional)" in the name and the tooltip
var fictionSeries = chart.series.push(am5map.MapPointSeries.new(root, {
  latitudeField: "latitude",
  longitudeField: "longitude"
}));

fictionSeries.bullets.push(function() {
  var container = am5.Container.new(root, {});
  // the circle has the tooltip: a tooltip takes its color from what it belongs to, and a container has none
  container.children.push(hoverable(am5.Circle.new(root, {
    radius: 6,
    fill: am5.color(0x2ec4b6),   // teal: not a real mission
    stroke: am5.color(0xffffff),
    strokeWidth: 2,
    strokeDasharray: [2, 2],     // a broken ring, as a second hint
    tooltipText: "[bold]{name}[/] (fictional)\n{story}\nFrom the novel The Martian (Andy Weir, 2011)",
    tooltipY: 0,
    cursorOverStyle: "pointer"
  })));
  container.children.push(am5.Label.new(root, {
    text: "{name} (fictional)",
    populateText: true,
    fill: am5.color(0x7fe3da),   // a lighter teal, readable on the dark planet
    fontSize: "0.8em",
    fontWeight: "600",
    fontStyle: "italic",
    centerX: am5.p50,  // centered under the marker, like the real sites' names
    centerY: 0,
    dy: 8,
    paddingTop: 0
  }));
  return am5.Bullet.new(root, { sprite: container });
});

// Ares 3: 31.3°N, 331.3°E (28.7°W), NASA image PIA19913; Ares 4: the centre of HiRISE image ESP_042014_1760
fictionSeries.data.setAll([
  { name: "Ares 3", story: "Acidalia Planitia: the Hab where Mark Watney is left behind", latitude: 31.3, longitude: -28.7 },
  { name: "Ares 4", story: "Schiaparelli crater: the ascent vehicle he drives 3,200 km to", latitude: -3.96, longitude: 15.2 }
]);

// Add zoom control: plus, minus and home buttons, at the bottom left
// https://www.amcharts.com/docs/v5/charts/map-chart/map-pan-zoom/#Zoom_control
var zoomControl = chart.set("zoomControl", am5map.ZoomControl.new(root, {
  x: 0,       // at the chart's left edge...
  centerX: 0,
  dx: 10      // ...10px in
}));
zoomControl.homeButton.set("visible", true); // the home button is hidden by default

// Add image credit, at the bottom right, on two lines
var credit = chart.children.push(am5.Label.new(root, {
  text: "Imagery: USGS Astrogeology Science Center; NASA Ames Research Center",
  fontSize: 11,              // small print
  fill: am5.color(0xffffff), // white, over the dark background
  fillOpacity: 0.6,          // a little see-through
  maxWidth: 190,             // wrapped onto two lines...
  oversizedBehavior: "wrap",
  textAlign: "right",        // ...lined up on the right
  x: am5.p100,               // at the chart's right edge...
  centerX: am5.p100,         // ...lined up by the label's own right side
  y: am5.p100,               // and at the bottom
  centerY: am5.p100,
  dx: -10,                   // 10px in from the edges
  dy: -10
}));

// Make stuff animate on load
// https://www.amcharts.com/docs/v5/concepts/animations/
chart.appear(1000, 100);
{
"type": "MapChart",
"settings": {
"panX": "rotateX",
"panY": "rotateY",
"minZoomLevel": 0.5,
"rotationY": -15,
"zoomControl": {
"type": "ZoomControl",
"settings": {
"x": 0,
"centerX": 0,
"dx": 10
},
"properties": {
"homeButton": {
"settings": {
"visible": true
}
}
}
},
"animations": [
{
"key": "rotationX",
"from": 0,
"to": 360,
"duration": 120000,
"loops": 0
}
],
"projectionName": "geoOrthographic"
},
"properties": {
"series": [
"#series-0",
"#series-1",
"#series-2",
"#series-3",
"#series-4"
]
},
"children": [
{
"type": "Label",
"settings": {
"text": "Imagery: USGS Astrogeology Science Center; NASA Ames Research Center",
"fontSize": 11,
"fill": {
"type": "Color",
"value": "#ffffff"
},
"fillOpacity": 0.6,
"maxWidth": 190,
"oversizedBehavior": "wrap",
"textAlign": "right",
"x": {
"type": "Percent",
"value": 100
},
"centerX": {
"type": "Percent",
"value": 100
},
"y": {
"type": "Percent",
"value": 100
},
"centerY": {
"type": "Percent",
"value": 100
},
"dx": -10,
"dy": -10
},
"index": 2
}
],
"refs": [
{
"data-0": []
},
{
"data-1": [
{
"name": "Viking 1",
"type": "Lander",
"place": "Chryse Planitia",
"date": "July 20, 1976",
"latitude": 22.27,
"longitude": -47.95,
"__parse": false
},
{
"name": "Viking 2",
"type": "Lander",
"place": "Utopia Planitia",
"date": "September 3, 1976",
"latitude": 47.64,
"longitude": 134.29,
"__parse": false
},
{
"name": "Pathfinder",
"type": "Lander and rover",
"place": "Ares Vallis",
"date": "July 4, 1997",
"latitude": 19.13,
"longitude": -33.22,
"__parse": false
},
{
"name": "Spirit",
"type": "Rover",
"place": "Gusev crater",
"date": "January 4, 2004",
"latitude": -14.57,
"longitude": 175.47,
"__parse": false
},
{
"name": "Opportunity",
"type": "Rover",
"place": "Meridiani Planum",
"date": "January 25, 2004",
"latitude": -1.95,
"longitude": -5.53,
"__parse": false
},
{
"name": "Phoenix",
"type": "Lander",
"place": "Vastitas Borealis",
"date": "May 25, 2008",
"latitude": 68.22,
"longitude": -125.75,
"__parse": false
},
{
"name": "Curiosity",
"type": "Rover",
"place": "Gale crater",
"date": "August 6, 2012",
"latitude": -4.59,
"longitude": 137.44,
"__parse": false
},
{
"name": "InSight",
"type": "Lander",
"place": "Elysium Planitia",
"date": "November 26, 2018",
"latitude": 4.5,
"longitude": 135.62,
"__parse": false
},
{
"name": "Perseverance",
"type": "Rover",
"place": "Jezero crater",
"date": "February 18, 2021",
"latitude": 18.44,
"longitude": 77.45,
"__parse": false
},
{
"name": "Zhurong",
"type": "Rover",
"place": "Utopia Planitia",
"date": "May 15, 2021",
"latitude": 25.07,
"longitude": 109.93,
"__parse": false
}
]
},
{
"data-2": [
{
"name": "Ares 3",
"story": "Acidalia Planitia: the Hab where Mark Watney is left behind",
"latitude": 31.3,
"longitude": -28.7
},
{
"name": "Ares 4",
"story": "Schiaparelli crater: the ascent vehicle he drives 3,200 km to",
"latitude": -3.96,
"longitude": 15.2
}
]
},
{
"series-0": {
"type": "MapRasterSeries",
"settings": {
"src": "https://cdn.amcharts.com/lib/5/geodata/images/mars2048.jpg"
}
}
},
{
"series-1": {
"type": "GraticuleSeries",
"settings": {
"step": 15
},
"properties": {
"mapLines": {
"properties": {
"template": {
"settings": {
"stroke": {
"type": "Color",
"value": "#ffffff"
},
"strokeOpacity": 0.1
}
}
}
}
}
}
},
{
"series-2": {
"type": "MapPointSeries",
"settings": {
"latitudeField": "latitude",
"longitudeField": "longitude"
},
"properties": {
"data": "#data-1",
"bullets": [
{
"type": "Bullet",
"settings": {
"sprite": {
"type": "Circle",
"settings": {
"radius": 6,
"fill": {
"type": "Color",
"value": "#ff6b35"
},
"stroke": {
"type": "Color",
"value": "#ffffff"
},
"strokeWidth": 2,
"tooltipText": "[bold]{name}[/] ({type})\n{place}\nLanded {date}",
"tooltipY": 0,
"cursorOverStyle": "pointer"
},
"states": [
{
"key": "hover",
"settings": {
"scale": 1.4
}
}
]
}
}
}
]
}
}
},
{
"series-3": {
"type": "MapPointSeries",
"settings": {
"latitudeField": "latitude",
"longitudeField": "longitude"
},
"properties": {
"data": "#data-1",
"bullets": [
{
"type": "Bullet",
"settings": {
"sprite": {
"type": "Label",
"settings": {
"text": "{name}",
"populateText": true,
"fill": {
"type": "Color",
"value": "#ffffff"
},
"fontSize": "0.8em",
"fontWeight": "600",
"centerX": {
"type": "Percent",
"value": 50
},
"centerY": 0,
"dy": 8,
"paddingTop": 0,
"interactive": false
}
}
}
}
]
}
}
},
{
"series-4": {
"type": "MapPointSeries",
"settings": {
"latitudeField": "latitude",
"longitudeField": "longitude"
},
"properties": {
"data": "#data-2",
"bullets": [
{
"type": "Bullet",
"settings": {
"sprite": {
"type": "Container",
"children": [
{
"type": "Circle",
"settings": {
"radius": 6,
"fill": {
"type": "Color",
"value": "#2ec4b6"
},
"stroke": {
"type": "Color",
"value": "#ffffff"
},
"strokeWidth": 2,
"strokeDasharray": [2, 2],
"tooltipText": "[bold]{name}[/] (fictional)\n{story}\nFrom the novel The Martian (Andy Weir, 2011)",
"tooltipY": 0,
"cursorOverStyle": "pointer"
},
"states": [
{
"key": "hover",
"settings": {
"scale": 1.4
}
}
]
},
{
"type": "Label",
"settings": {
"text": "{name} (fictional)",
"populateText": true,
"fill": {
"type": "Color",
"value": "#7fe3da"
},
"fontSize": "0.8em",
"fontWeight": "600",
"fontStyle": "italic",
"centerX": {
"type": "Percent",
"value": 50
},
"centerY": 0,
"dy": 8,
"paddingTop": 0
}
}
]
}
}
}
]
}
}
}
],
"root": {
"properties": {
"interfaceColors": {
"settings": {
"primaryButton": {
"type": "Color",
"value": "#2a3042"
},
"primaryButtonHover": {
"type": "Color",
"value": "#3a4259"
},
"primaryButtonDown": {
"type": "Color",
"value": "#485170"
},
"primaryButtonActive": {
"type": "Color",
"value": "#485170"
},
"primaryButtonDisabled": {
"type": "Color",
"value": "#1c2030"
},
"primaryButtonTextDisabled": {
"type": "Color",
"value": "#5c6278"
},
"primaryButtonText": {
"type": "Color",
"value": "#e6e8f0"
},
"primaryButtonStroke": {
"type": "Color",
"value": "#4a5370"
},
"background": {
"type": "Color",
"value": "#0b0e18"
}
}
}
}
}
}