Use case: hanglos.nl
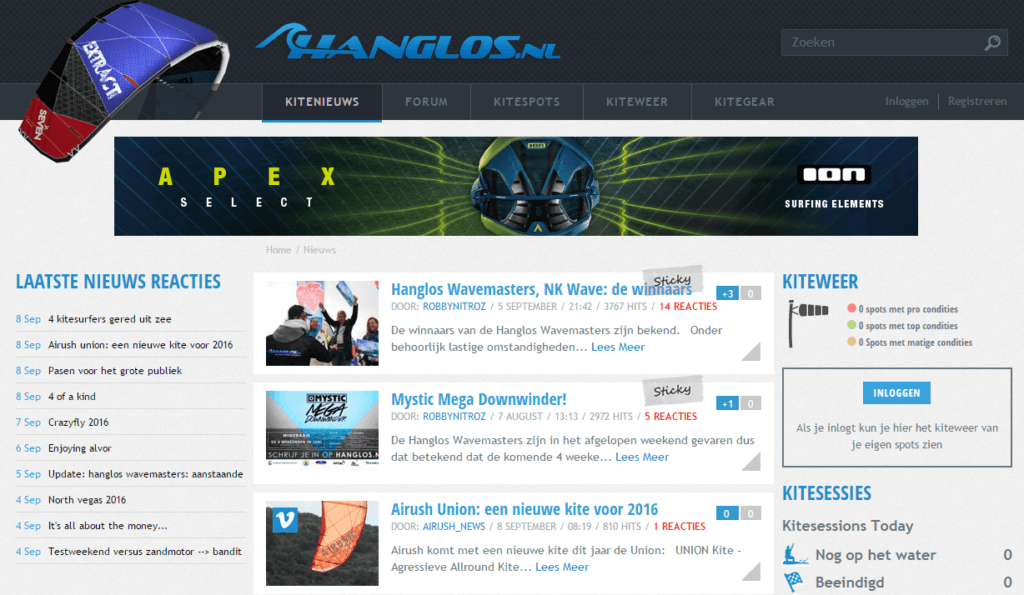
hanglos.nl – a website dedicated to kitesurfing community in The Netherlands – took it to amCharts to visualize their data on weather conditions. The developers pushed the charts to the limit by applying a number of advanced techniques to make the charts both very useful and attractive.
This post will outline a few of those.
Value-bound Striped Fills
The requirement called for two date/time-based graphs, with fill between them. While it being easy, the requirement was to fill using multiple colored stripes that start and end at certain values.
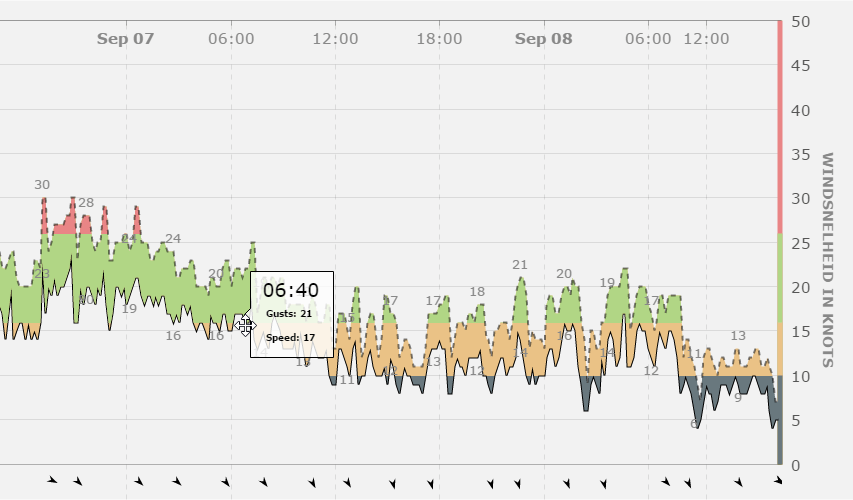
The team managed to achieve that by leveraging amChart’s ability to alternate the colors and opacity of the fills between below and above “positive”/”negative” threshold. (negativeBase) and by using multiple overlaid graphs with different negative thresholds to create the effect of multiple strip fills.
Trend lines were used to display the wind direction icons. A trend line is an object that can start and end at any point and value of the chart. It can also have SVG icons attached to its either end, which in turn can have color, size and rotation set. This proved to be perfect application for the task.
See this in action.
Lazy-loading of Charts
Another page on the website presented yet another challenge. While the above chart is complex, the charts on the are very basic, but there are a lot of them.
One chart takes fractions of a second to build. Yet, having tens of those can add up to significant load on the browser and bog it down, degrading user experience.
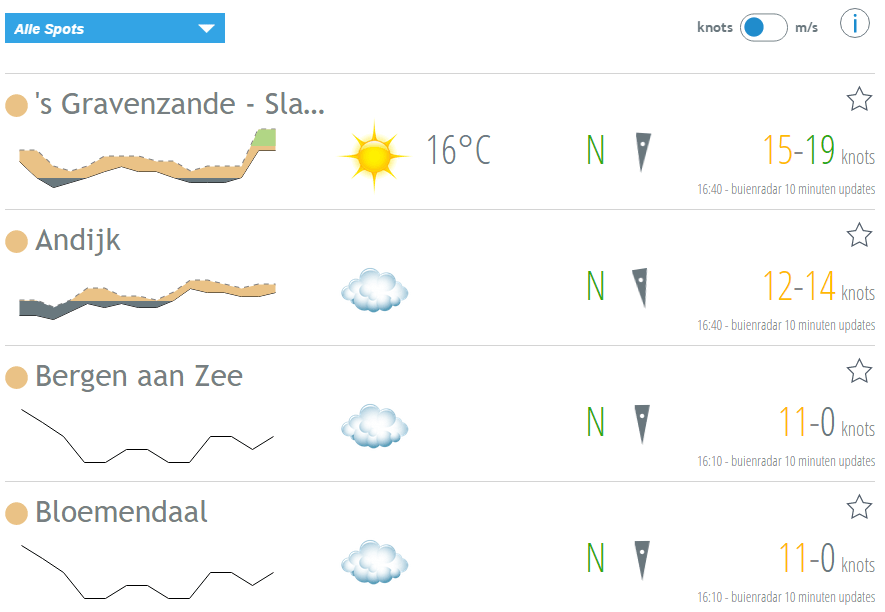
The team overcame it by applying the “lazy-loading” technique. This means that charts initialize only when they are actually scrolled into view. This means that the page has to initialize only a few charts on load, leaving the rest for later.
The approach not only saves the day by reducing overall initial load, but also produce a nice side-effect of animating the charts as they appear on page when scrolling.
To apply lazy-loading for your own charts, check out the basic plugin code on this example.
Here’s a page in question.
More info?
Check out amCharts website for more clever and sometimes crazy demos, tutorials and tips.
Or, should you need assistance with your own charts, drop a line at contact@amcharts.com.