JavaScript Charts Visual Editor is now live
I could start with how proud we are, or how we worked hard, or similar blah blah blah. Instead I’m just going to say that we’re frickin’ excited senseless to finally bring you the brand new and shiny JavaScript Charts Editor!
Create, configure, tweak, edit data, export, import, save, share in a single interface, the user-friendly way. Make sure you bookmark the new destination for all your charting needs:
live.amcharts.com
OK, now that I’m done with emotional intro. Here’s what you can do with the new Editor:
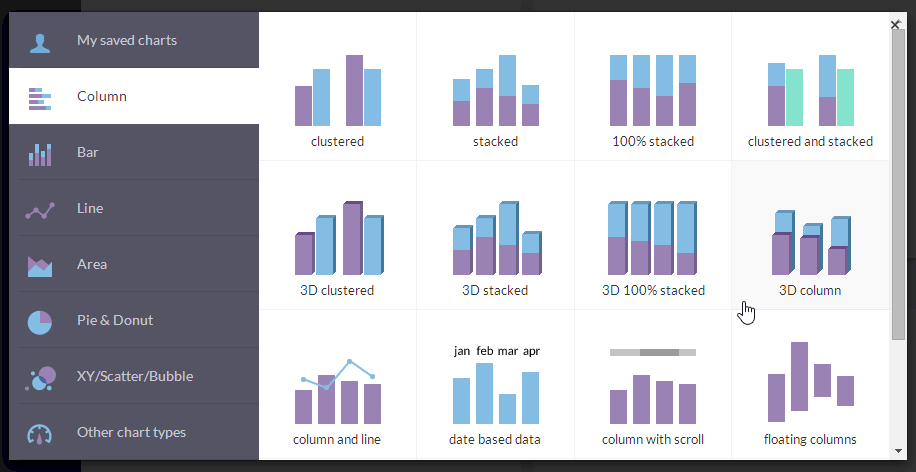
Choose from tens of the predefined chart templates to jump-start your chart creation.
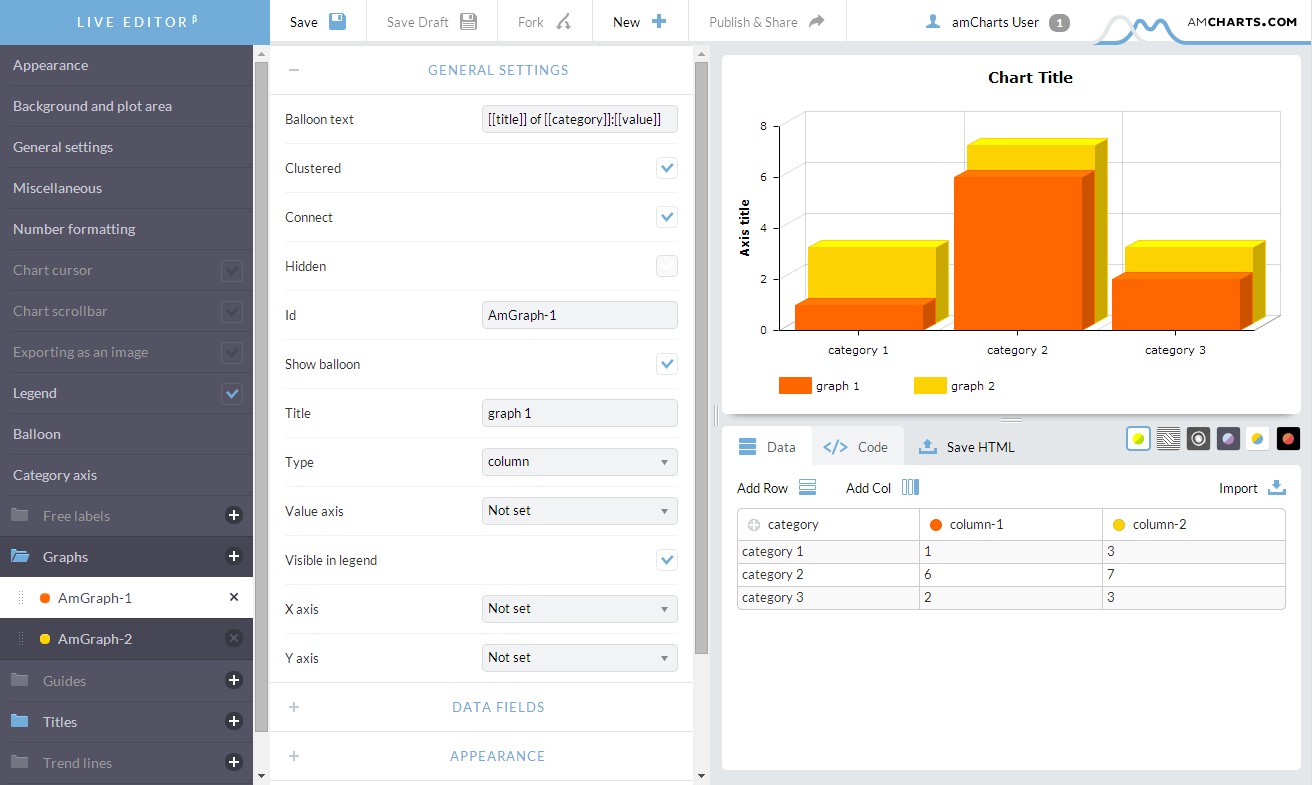
Edit any, yeah we’re serious, ANY possible parameter, including switching between themes. See any change you make reflected immediately on the preview chart.
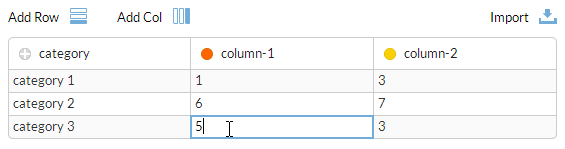
Import CSV/Excel files and edit your data right there in the same interface.
Save chart “public” version of the chart, work on internal draft or publish them for the world to see.
![]()
Instantly and easy publish to web. Customize it with beautiful backgrounds and other appearance settings.

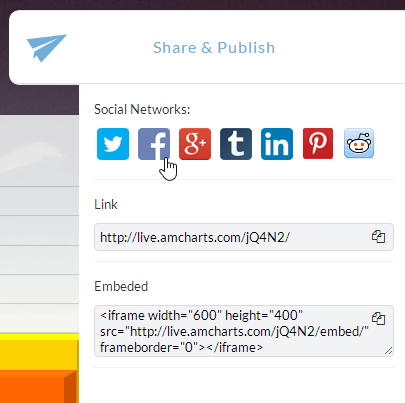
Easily share with your friends on Facebook, Twitter, Google+ or other social networks, blogs or embed directly into your website using <iframe> tag
Come back to your saved charts to tweak and edit them, make copies, have fun!
